

- Imperial Brands PLC changed its direction to an uptrend.
- The IMB stock is retesting near its previous support zone.
- The Imperial Brands PLC stock price is trading below the 200-day EMA.
The Imperial Brand PLC (LON: IMB) stock has been trading in an uptrend since it broke out of a downtrend from Jan 2017 to Jan 2020. IMB stock’s price is currently trading between the 2185.00 level to the 1190.00 level.
The stock price is retesting near the 2185.00 level, trying to make a swing low structure. However, there is a major support level at 1694.50. It can play an important role in continuing the uptrend.
In a monthly time frame, the stock price is trading below its 200-day EMA. In the month of May 2023 trading session, the IMB price dropped by -13.85% from an impulsive single bearish candle.
The IMB Stock is Retesting Near the Previous Support Zone
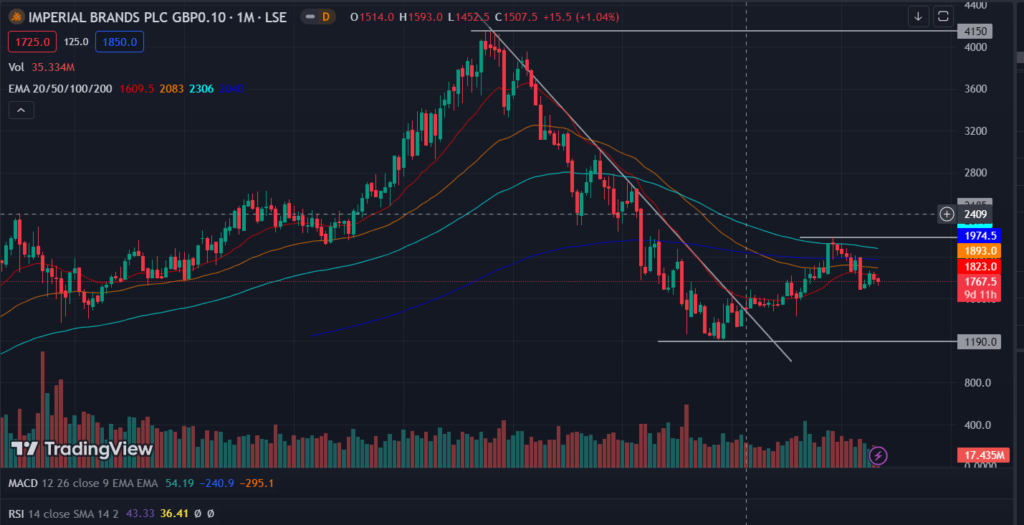
On a Monthly time frame, the Imperial Brands PLC is performing below all EMAs. However, as per the chart, the stock price broke the downtrend and formed a new uptrend. It created a range that is more likely to become a consolidation zone from 2185.00 to 1190.00.
The IMB stock price is rejected from a support level of 1688.40. Probably, this support level can attract a lot of buyers into the stock.
The probability of the price dropping will increase until it touches the 1190.00 level. if it does not return from its support level at 1688.40. After breaking down this point, the stock price will continue to trade in a downtrend.
Will the IMB Stock Price Continue Dropping to the 1666.40 Level?
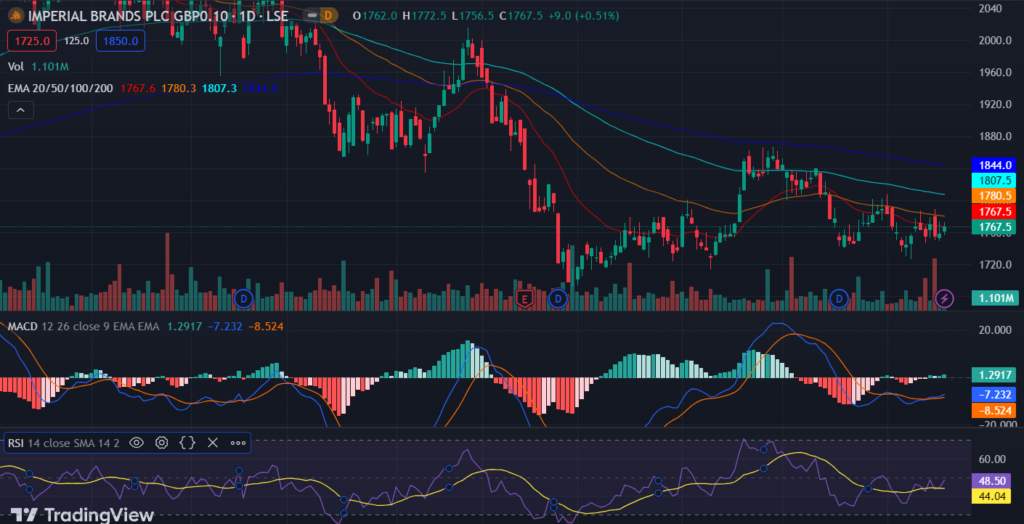
This chart shows the daily Technical Analysis of the IMB stock. As we can see, all 4 EMAs are averaging above the current market price of 1767.50. Those EMAs are 20-day at 1767.5, 50-day at 1780.5, 100-day at 1807.5 and 200-day at 1844.0. It shows the stock will probably continue to trade in a downtrend for a certain amount of time.
The MACD line is at -7.232 and the signal line is at -8.524, showing the selling volume is high compared to the buying volume. Both the lines are constantly averaging near each other in a lower direction.
The relative strength index (RSI) shows the strength at 48.50, which is basically in a middle zone. The signal line at 44.04, indicating the IMB stock has entered a low strength zone.
However, the stock price is currently trading near its daily supply zone, more likely to continue downward.
The IMB Stock Can Reach 1666.00 Support Level
Technical Levels
- Resistance Levels: 1807.50 and 1862.00
- Support Levels: 1467.50 and 1645.5
Disclaimer
The views and opinions stated by the author, or any people named in this article are for informational purposes only. They do not establish financial, investment and any other advice. Investing in or trading stock assets comes with a risk of financial loss.


: Is the IMB Stock Price Retesting?)