

- Banco Santander S.A. is a Spanish multinational financial service company. The firm was founded on 15 May 1857.
- It is listed on the London Stock Exchange. Besides, it’s the 19th largest banking institution in the world.
- In this article, we will analyze the BNC stock price movements.
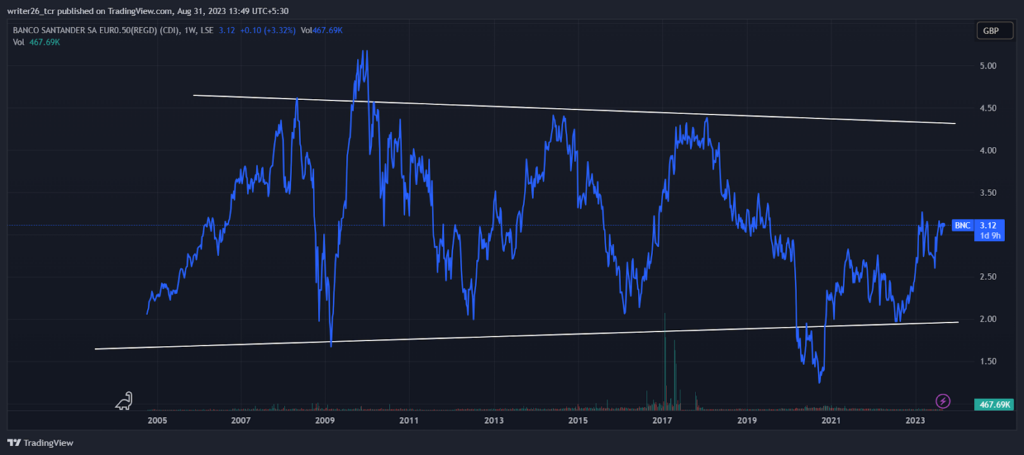
The BNC stock has been in a sideways position since 2004. It has been trading in a range between the support level and the resistance level. The chances of breakout are not very much sure. The chances of the stock moving up or breaking its range are not possible. It has been in that range since 2004.
Its volume chart is also low and there is no clarity on whether the stock is bearish or bullish. The volume candle in 2017 clearly shows that the stock was in a bullish position.
Moreover, the stock is not good for long-term investment because it is in a range. The breakout can be downward or upward.
Technical Analysis of BNC (Yearly)
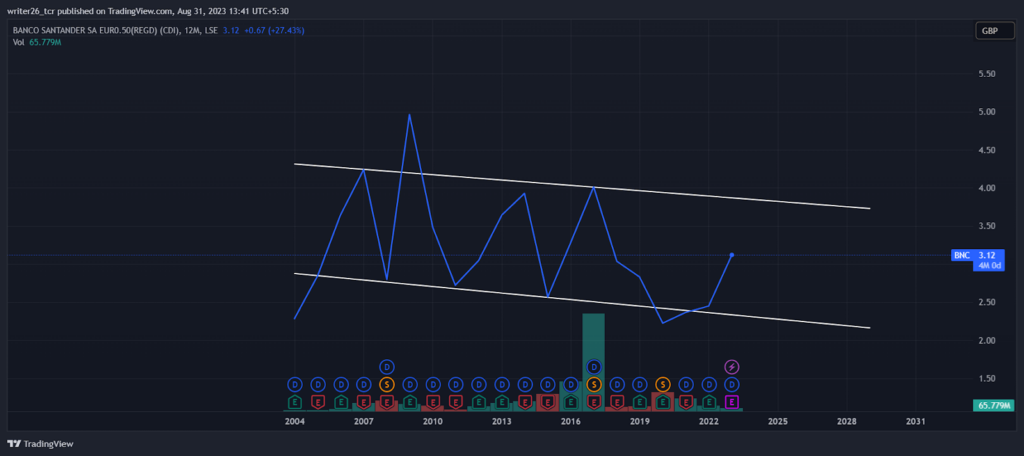
In the yearly time frame, the stock is in a range. That means it is being traded between the resistance level and the support level. If the stock gives a breakout, its movement can be in either way. Therefore, it is not an ideal choice for long-term investment. However, it can be a good choice for small or sure sort returns.
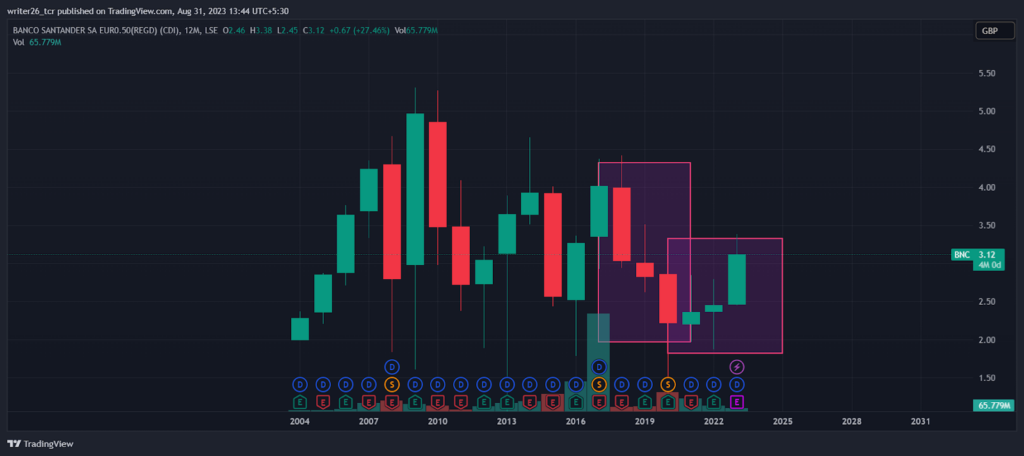
The three black crows in the first rectangle indicate that the stock may continue its downtrend. However, the stock started to make the pattern of three white soldiers after the formation of three black crows. That indicates the stock may continue its upward move.
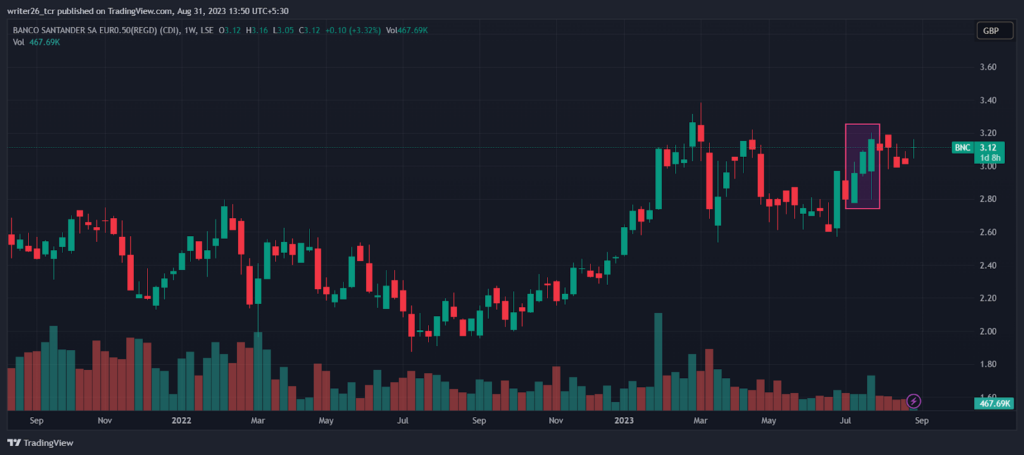
Technical Analysis of BNC (Monthly)
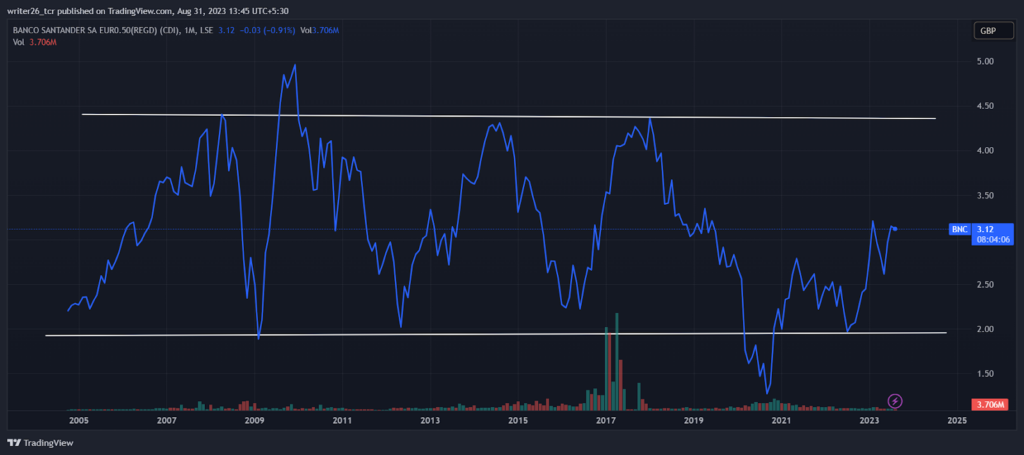
In the monthly time frame, the stock is trading within the range. So, it is not good to invest in this stock. The chances of good returns become less or restricted due to its range. If any investor wants to buy it they should buy this stock at the 2 GBP price. Sell it at the 4.40 GBP price.
The pattern present in the rectangle shows three black crows. It indicates that the stock can break the earlier trend or can continue its downtrend. In this case, the stock broke the uptrend and could not continue its downtrend.
Technical Analysis of BNC (Weekly)
In the weekly time frame, the chart is in range for the swing position. The stock is not very suitable. It may not give a good return on the investment. However, the stock can give small or sure returns to its investors.
The pattern presented in the rectangle represents the three white soldiers. It indicates that the stock may break the earlier trend. It can continue the up move. In that case, the stock broke its earlier trend but could not continue the up move.
Technical Analysis of BNC (Daily)
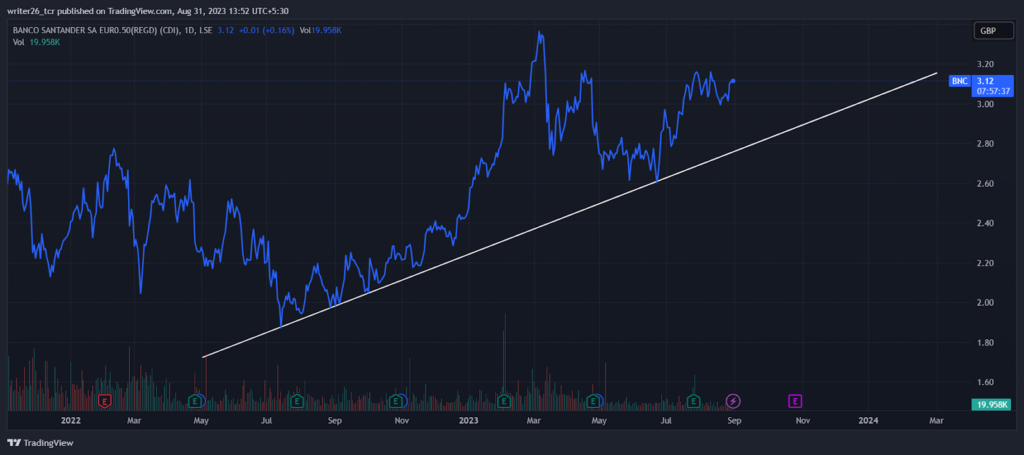
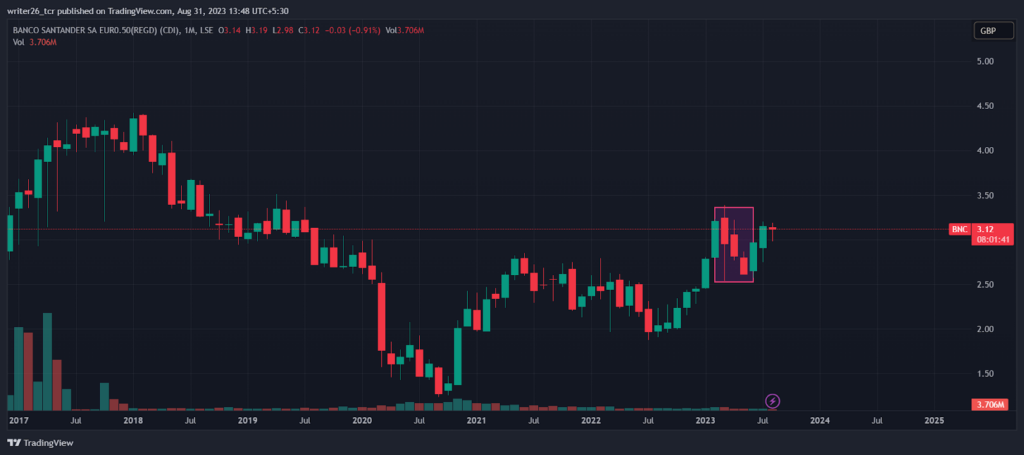
In the daily time frame, the stock is in an uptrend. It can give good returns to traders. If it is bought at the support present at the trend line and sold at different prices by placing a trailing stop loss to generate some profits when the stock starts the retracement.
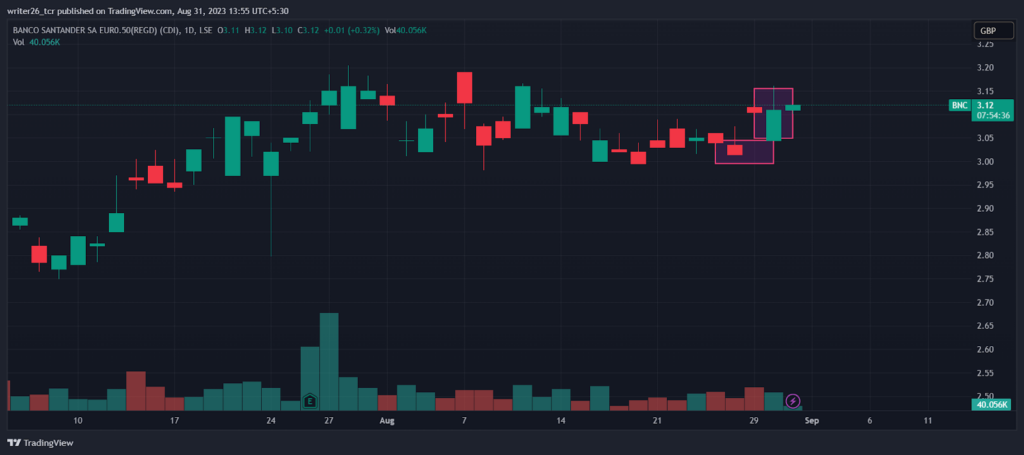
In the rectangle, the pattern is an inverted hammer. It means the stock can continue its downtrend again. So, the traders should trade carefully. It is a good opportunity for short sellers.
Summary
The stock is in a sideways position in the yearly, monthly, and weekly time frame. So, for positional or swing traders, it is better to invest in another stock. It is in an uptrend in the daily time frame, so traders should take advantage of this stock.
Levels
Resistance Level- GBP- 2.0 and GBP- 2.63(Daily Time Frame)
Support Leve- GBP- 3.25 and GBP- 4.28(Daily Time Frame)
Disclaimer
The analysis is done to provide information through technical analysis and no investment suggestions are given in the article.


