

- BTT price has declined (- 3.41 %) in a week, (-15.72%) in a month and (-53.29 % ) in a year.
- Bittorrent price has declined over ( – 79.6 % ) since listing and about (- 84% ) from it’s all time high.
- Liquidity is a major concern for an investor as the volume is very low and price is showing some drastic movement on both the side.
Current market capital of BTT – $ 374.48 M
Current market price of Bittorrent – $ 0.00000038
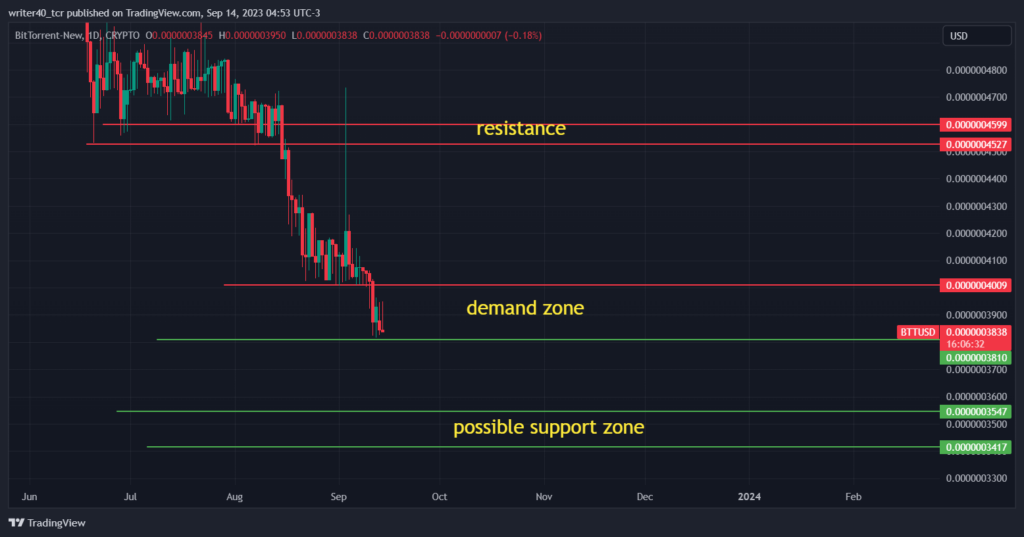
BTT price has fallen till this level in a very similar kind of pattern, it forms a base and then give a major downfall, if we watch carefully the stock is currently doing the same as the price after a major decline forming a base at $ 0.000000381 level and the price has broken down the previous resistance of $0. 0000004009.
Price on 3rd september showed a massive rally of 18% in a single day where it tried to break the resistance but failed miserably, as the price faced a strong rejection from the upper level of $0.0000004527 and $0.0000004599. Price took a sharp reversal and closed the day with a rise of 3.14 % only.
Does BTT have a future?
As the BTT price is trading in a bearish trend, it is difficult to say when it will move up. We can only make the assumption that the price of BTT can rise only after it breaks the important resistance area. The important resistance area is standing near to the levels $ 0.0000004009. If we talk about support levels then it is placed near $0. 0000003810.
If the price breaches the resistance levels on upside then there is a major possibility that the stock will go up till $0.0000004527 and $0.0000004599. If the price breaches the lower levels then it will unlock the lower levels of $0.0000003547 / $0.000000 3147. The sellers seem to be much aggressive on each level as the buyers fail to provide any major impact on price.
Will the BitTorrent coin reach $1?
If we talk about some stats the bittorent price has never achieved $1 even when the crypto market was super bullish. So expecting a 270000000% on upside for the level $1 is unrealistic even on a longer time horizon. The price is currently trading in a bearish trend as the price is trading below all the major EMAs which is a bearish sign.
https://www.tradingview.com/chart/ruBma0Io/?symbol=CRYPTO%3ABTTUSD
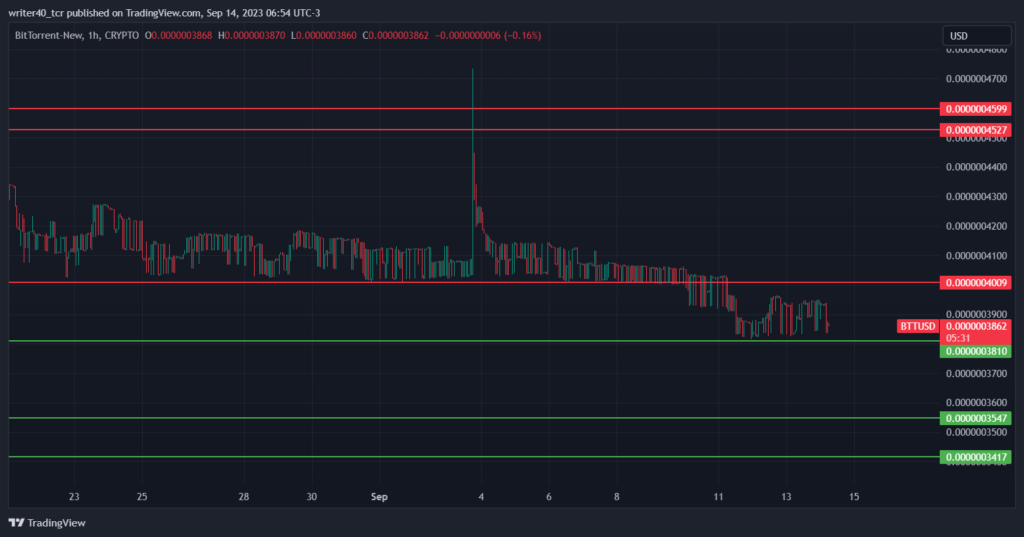
If we take a look at the 1 hour chart then we can observe that there is some liquidity issue in this crypto. The price is very volatile and moving up and down frequently which means there is some lack of volume i.e (bids and offers). Price forms a range in a 1 hour time frame and continues to trade in the range for some time and then only it breaks that range.
Conclusion
The price is very bearish as of now and seems like it will continue the same momentum ahead.
Price can go up significantly only when it clears the $0. 0000007679 levels i.e the inverted flag and pole pattern breakout. If the price goes down it can take the support of trend line based fibonacci levels of $ 0.0000003547 and $ 0.0000003417.
Technical levels
Resistance – $0.0000004009 and $ 0.0000004527
Support – $ 0.0000003810 and $ 0.0000003547
Disclaimer
The analysis is done for providing information through technical analysis and no investment suggestions are given in the article to be made by investors. The coins are unpredictable so investors should have proper knowledge. Cryptocurrencies are highly volatile and risky. Investment should be made with proper technical analysis


 price: following a similar pattern for downside.)