

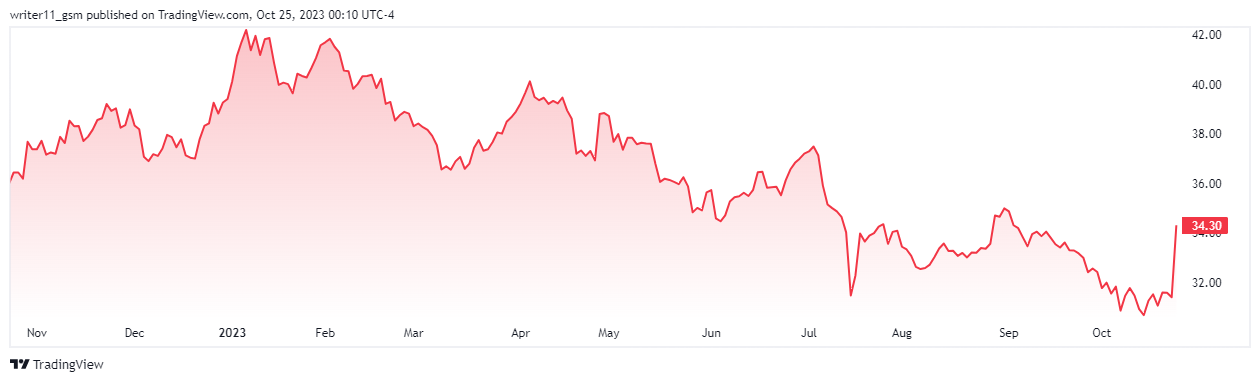
- VZ stock price has advanced by more than 9% in the last trading session.
- The reported debt of Verizon Communications is much higher than its revenue.
Verizon Communications operates in the communication sector and wireless telecommunications industry. The current CEO of Verizon Communications is Hans Erik Vestberg. The company has more than 100K employees working for it and has its headquarters in New York. It was founded in the year 1983 and was formerly known as Bell Atlantic Corporation. On June 16, 2000, it became Verizon Communications.
The current market cap of Verizon Communications Inc. is $144.199B followed by a beta of 0.72. This makes the stock price less volatile and more volatile as compared to the whole market.
The VZ stock earns $4.97 on each share as its basic earnings-per-share is 4.97 USD. For the last three months, the VZ stock has been trading with an average volume of 22.75M shares. The last trading session’s volume breached the average volume resulting in 61.617M.
The company has a very good price-to-book value of 1.52. Despite this, the current ratio of Verizon Communications is poor resulting in 0.73. This represents that the company does not have enough potential to repay its debt.
Financial Performance For VZ Stock
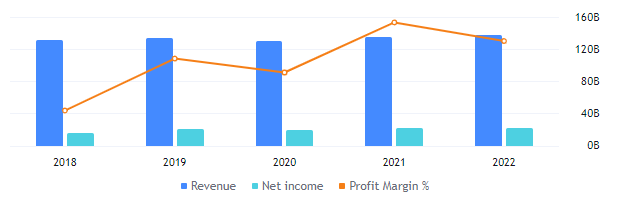
Verizon Communications Inc. made a net income of $21.26B in the year 2022 resulting in a profit margin of 15.53%. The profit margin of the company has slightly declined by $0.81B as compared to the last year reported in the year 2021. The reported debt of the company is $176.33B which is slightly lower than last year.
Buyers Show Their Dominance In The Recent Price Action, What Could Be Next Move?
The share price of VZ stock has been consistently declining making lower highs and lower low patterns since June 2015. The price has been consistently declining from the high of $62.22. This decline in price led to a low of $30.14 and the price is currently trying to rebound.
Based on the most recent price action the share price is consistently declining from higher levels making lower levels. This has led to the formation of an expanding wedge pattern and the price is currently trading at the edge of the pattern. The most recent price action shows the dominance of buyers as the price is up by more than 7% in just one trading session.
The EMAs on the daily charts of the VZ stock are trading in a death cross. Despite this, the share price has broken above the 50-day EMA which indicates the presence of buyers in the stock price.
The RSI for the VZ stock is totally bullish trading at a level of 65.73. The current level of the RSI is very close to overbought zones. This can lead to an uptrend in the VZ stock in the upcoming days.
Conclusion
Despite consistent advances in the revenue of the company, the debt of Verizon Communications is too high. The current price action of the stock on the daily timeframe represents bullishness. The VZ stock price has witnessed a sudden surge in the price of the stock in the last trading session. The indicators are also getting bullish. Therefore, if the VZ stock price breaks above the falling wedge pattern, we might get to see higher prices in the share price.
Technical Levels
- Support levels– $25.00 and $25.10
- Resistance levels– $35.00 and $40.00
Disclaimer
The information provided in this article, including the views and opinions expressed by the author or any individuals mentioned, is intended for informational purposes only. It is important to note that the article does not provide financial or investment advice. Investing or trading in cryptocurrency assets carries inherent risks and can result in financial loss.


