
- The price of Synthetix (SNX)is trading at $1.986.
- The 24-hour volume is $24,132,323, which increased by 38.68%in 24 hours.
- Synthetix (SNX) price has increased by 2.01% daily.
A decentralized finance (DeFi) mechanism called Synthetix was developed on the Ethereum network. Synthetic assets, which are tokenized representations of real assets like currencies, commodities, equities, and indexes, can be created and traded by users. Users can access these assets through Synthetix without holding the underlying assets themselves.
Trend Analysis
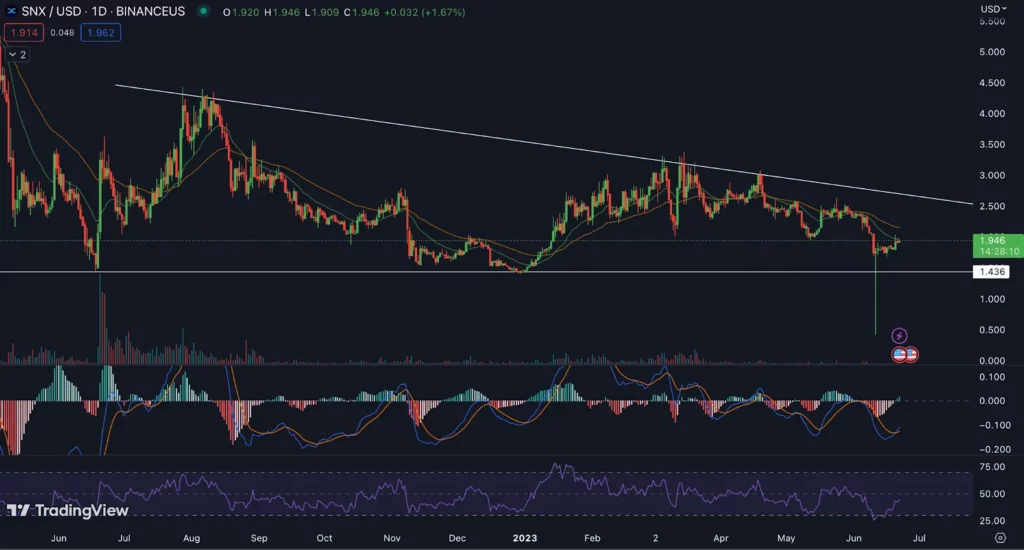
By looking at the trend and price information in the chart, we can find that Synthetix (SNX) is in a downtrend, making lower lows. It has reversed from the support level, and the price is trading in between the triangle pattern. The Return On Investment (ROI) of Synthetix SV has increased by 332.27%% and has recently made its all-time low of $0.03258.
BSV is Trading in Downwards Direction
Technical Analysis (1D Timeframe)
Synthetix (SNX) Price Analysis
EMA
The SNX price currently trades below the 20-50 EMA. Based on the EMA analysis, the SNX price recently dropped below the 50-day EMA, indicating a potential short-term downtrend. However, it remains above the 200-day EMA, suggesting a relatively more favorable long-term outlook.
RSI
When looking at recent price action, we can observe several key technical indicators to better understand potential SNX movements. Let’s start with the Relative Strength Index (RSI), which is a momentum oscillator that measures the speed and direction of price movement. The RSI moves in between the range of 0 and 100, a value above 70 indicates overbought conditions and a value below 30 indicates oversold conditions.
Currently, the RSI for the SNX for the day is hovering around the 50 level, indicating a relative equilibrium between buying and selling pressure. This shows that there is no significant buyer or seller dominance at this point. Traders can interpret this as a consolidation or indecision phase, during which the SNX price stabilizes after a previous rally or correction.
MACD
Looking at the recent price action of SNX, we observe that the MACD line is below the signal line, indicating a potential bearish signal. This shows that selling pressure may be stronger than buying in the short term. However, it is important to consider other factors and use additional analytical techniques to confirm this signal.
Trendline Analysis:
As per the Trendline, the price is respecting the trendline and the price is reversing from the support level indicating further move till the above line of the channel. But the chances of breaking the above level are “quite less”.
Conclusion
In conclusion, based on RSI and MACD analysis, SNX is currently in equilibrium with no clear trend. The RSI shows a relatively neutral condition, while the MACD shows a bearish diagonal. Traders and investors should monitor the conditions carefully and wait for the breakout before entering.
Technical Levels:
- The Nearest Support Zone is $14.36
- The Nearest Resistance Zone is $2.671
Disclaimer
The views and opinions of the author, or anyone named in this article, are for informational purposes only. They do not offer financial, investment, or other advice. Investing or trading crypto assets involves the risk of financial loss.


