

- The price of GRT is trading at $0.109.
- The GRT price increased by +0.64% in the last 24 hours.
- The GRT year-to-date return is +97.65%.
Weekly Trend Analyzation
This week the trend was bullish as the price was up by 13%. We can say that GRT is performing w by direction and price information history tell.
All-Time History Analyzation
The coin’s value plummeted by more than 15% in all-time history, giving average returns to the investors’ money.
In 1-D Timeframe
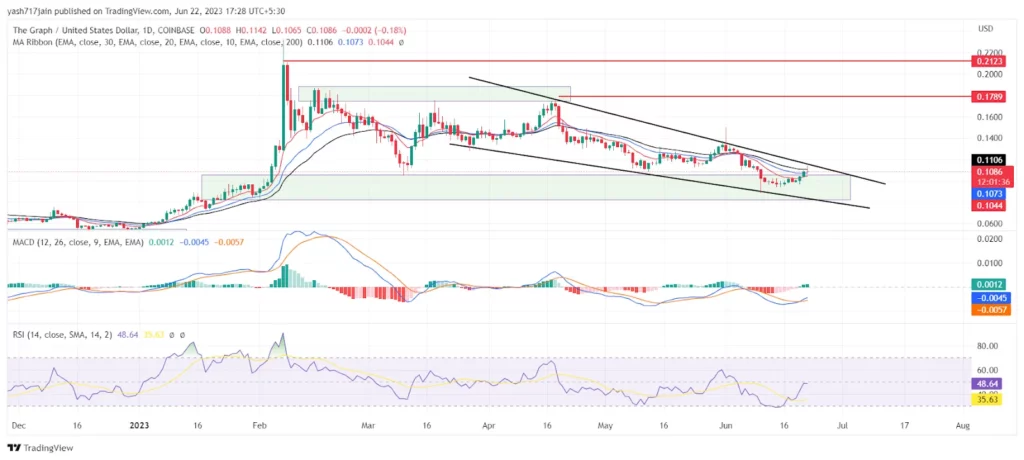
Trendline Analyzation
As per the trendline, it respects multiple support and rejection very well, taking from the drawn trendline on the chart. Recently, it formed a commonly seen bullish pattern known as descending wedge. In this pattern, the price gives an upward breakout. Therefore, we can observe that the price can climb up even further soon. It already took support on the trendline, and it might give a breakout soon as it is on the verge of giving it soon in the near time. It can reach $0.17 soon, which is the closest significant resistance.
RSI
The RSI line has been inclining and approaching the overbought territory or the overbought level of 70. The 14 SMA has a value of 35.71 points, and the RSI line is around 49.65. The RSI suggests that the market may shoot coin prices upward.
MACD
As we can see in the chart, the blue line or MACD line crossed the signal line from below while making a bullish crossover. This indicates a bullish trend signal. This highlights that the trend may continue upward.
EMA
The price is going up on the 1D chart. It is above the 10, 20 & 30 EMA (exponential moving average), supporting the trend upwards. The buyers are more robust than the sellers, showing buyers are ready to buy at every price. The price has to go down and stay below the 10, 20 & 30 EMA to change the direction. Also, the price remained above EMA’s, giving quite an idea that buyers are ready to buy the stock at every cost, which is also a good sign.
Bollinger Band
The Graph coin (GRT) price trades at the upper band in the Bollinger Band indicator. After taking support from the 20-day Simple Moving Average (SMA) of the Bollinger Bands, it indicates a more upward move.

Volume Analyzation
The amount of GRT traded in a day is $51546904. It rose by 28.44% since the last day. The trading activity is comparatively good in GRT now because the market is favourable, and the presence of buyers for the coin has also increased significantly. Therefore, it can push the price up due to the considerable volume present in the market.
Conclusion
The GRT coin price, as per the price action, is bullish. Currently, the technical parameters indicate bullish pressure in the upcoming trading days. The sentiments of investors and traders are bullish.
Technical Levels:
- The Nearest Support level is $0.097.
- The Nearest Resistance Level is $0.179.
Disclaimer
In this article, the views and opinions stated by the author or any people named are for informational purposes only, and they don’t establish the investment, financial, or any other advice. Trading or investing in cryptocurrency assets comes with a risk of financial loss.


