

- The IOTA price is currently trading at $0.1724 while observing a -0.92% decrease during the intraday session.
- Year-to-date return on the IOTA price is 2.07%, and the three-month return is -13.07%.
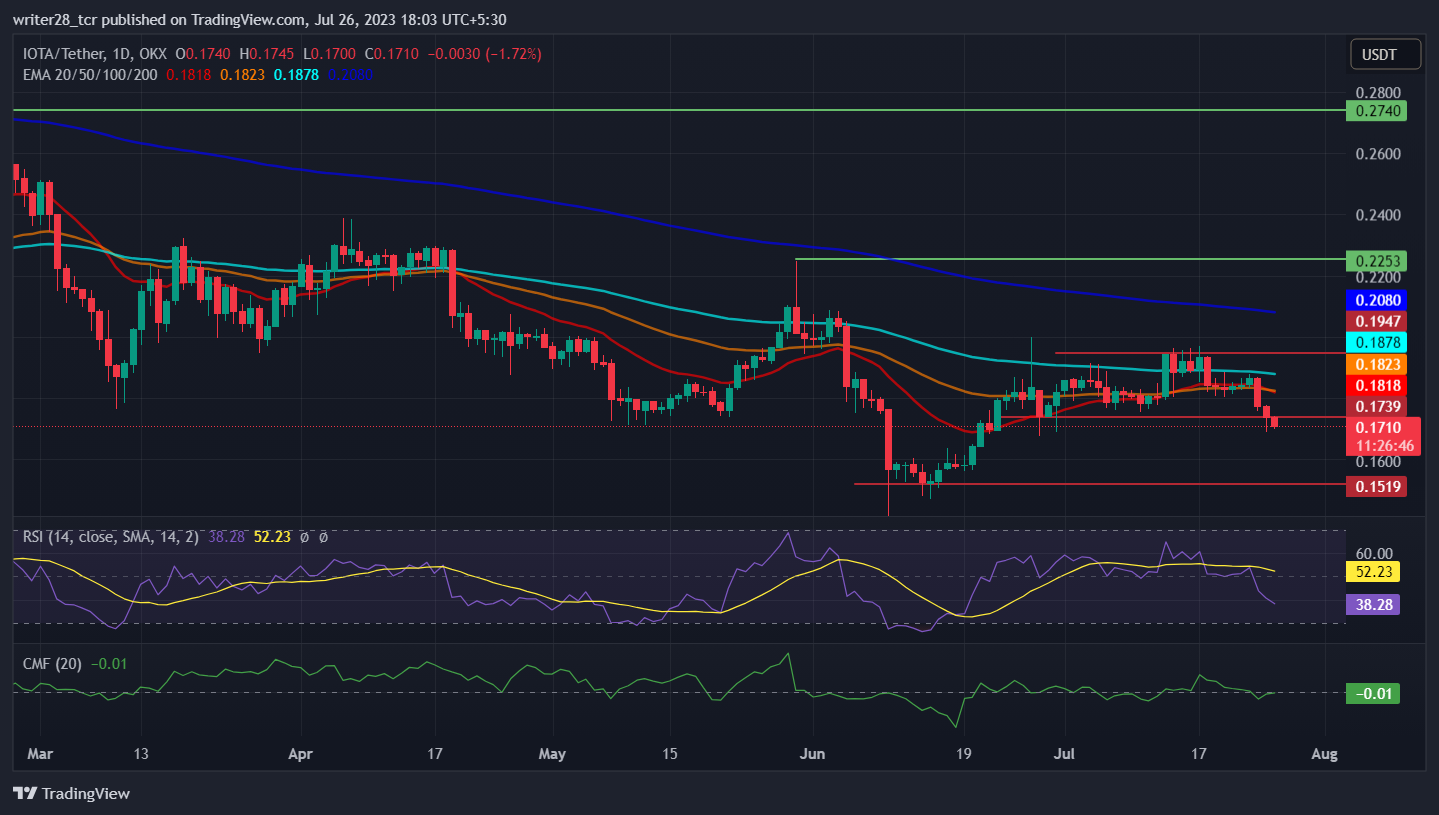
- The MIOTA price is currently trading below the 50, 100 and 200-day EMA.
The IOTA price had a kick-start in the initial time of 2023, with a rising momentum from $0.1695 to the annual high at $0.2746 in February, but was halted there with a resistance level. From there, the IOTA price has reflected the bearish momentum in the market, with plenty of ups and downs in the price candle.
As the IOTA price has entered Quarter 3, as the long march of bulls and bears sustain in the market, the IOTA price is lingering in the consolidating zone. But the weekly and monthly return, which is -6.66% and -5.38%, respectively, suggest the bearish momentum diverging the flow of the crypto price.
Hence, the IOTA price currently trades at $0.1724 with a 24-hour trading volume of $6,715,375. The IOTA price is presently witnessing a 0.93% decrease. The current market capitalization is $479,131,406, with a circulating supply of 2,779,530,289 MIOTA.
Furthermore, if the current candle breaks the previous candle’s low, there is a high probability the price will melt towards the $0.1520 level.
MIOTA Price (IOTA/USDT): Technical Analysis
The MIOTA price, trading below the 50, 100, and 200-day EMA, indicates a long march of sellers in the market. The trajectory is also in the downward momentum.
The RSI traded at 38.67 in the past 24 hours. RSI denotes weakness in the market, as showing a rising bearish momentum.
The Chaikin Money Flow score is -0.00 during the intraday session, indicating neither strength nor weakness in the market. The price action and CMF indicator show the different price structures.
The long and short ratio is 0.9786, with longs at 49.46% and shorts at 50.54% in the last 24 hours. By considering this, the momentum in the market pin-out the heavy participation of the sellers in the market.
Conclusion
The market structure indicates the bearish phenomenon that began when the IOTA price accomplished the annual high in February. From there, the market bears compete for their dominance, resulting in the crypto price’s shrinking.
Hence, the IOTA price has been sinking downward at a consistent pace. Investors can look for the selling opportunity as the indicators reflect the same.
Technical Level
Major support: $0.1347 and $0.1768
Major resistance: $0.2746 and $0.2250
Disclaimer:
The views and opinions stated by the author, or any people named in this article, are for informational purposes only and do not establish financial, investment, or other advice. Investing in or trading crypto assets & stocks comes with a risk of financial loss.


