

- The price of MSFT is trading at $342.33.
- The MSFT price decreased by 1.16% in the last 24 hours.
- The MSFT year-to-date return is +40.83%.
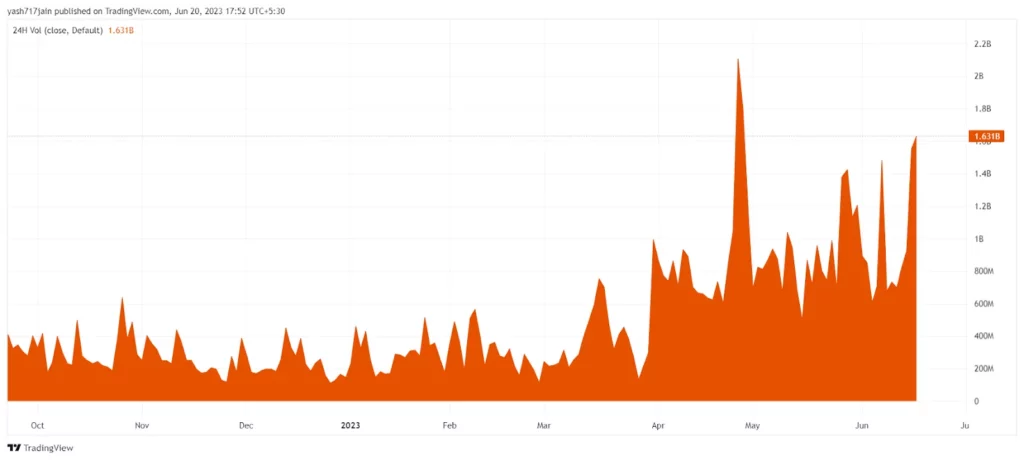
Volume Analyzation
The amount of MSFT traded in a day is $1.631 Billion. The trading activity is high now because the market is favorable and volume is present in stock as well as buyers for the stock. Therefore, it can push the price upwards as the sentiments are positive due to good volume present in it.
Trend Analyzation
This week the trend was bullish as the price was up by 5.34%. By trend and price information history, we can say that MSFT is performing well right now. The stock value surged by more than 352000% in all-time history, giving good returns to the investors’ money.
Fundamental Stats
- The stock market capitalization is $2.545 Trillion.
- The stock’s dividend yield is 0.79%.
- The stock price-to-earning ratio is 37.73.
- The stock’s basic EPS is $9.26.
Source: MSFT/NASDAQ by TradingView
Recently, the Q3 earnings of MSFT were made public in late April which created a positive impact on the price. Following this, the price made a bull rally of 25% projecting the optimism of buyers.
In 1-D Timeframe
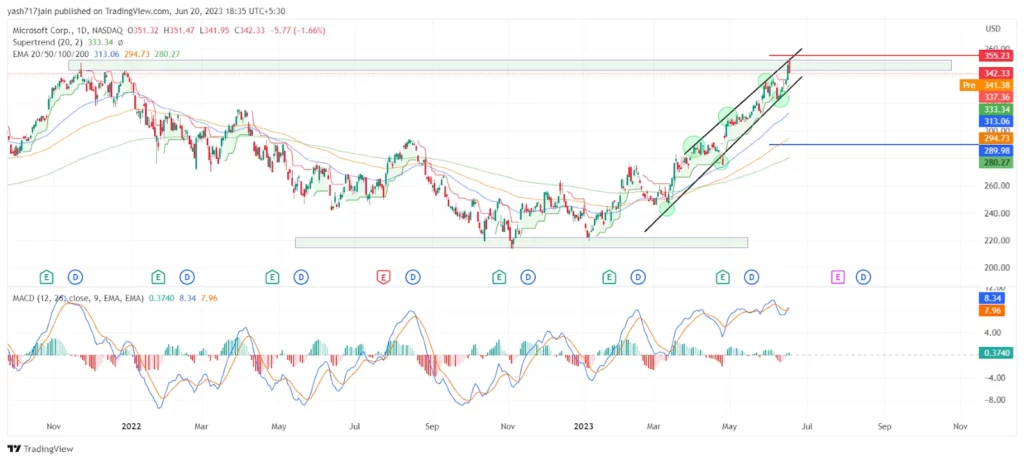
Trendline Analyzation
As per the trendline, it’s respecting the trendline and taking support exactly from the drawn trendline on the chart. So, as price action speaks, it may follow the channel and go more bullish.
Supertrend
With the help of just two parameters: period and multiplier, this indicator works well. At period value 20 and multiplier value 2, it shows the continuous trend if it’s bullish or bearish. As shown in the chart, it’s bullish.
MACD
As we can see in the chart, the blue line or MACD line crossed the signal line from below while making a bullish crossover. This indicates a bullish trend signal. On the day of writing, the MACD line and the signal line are on the positive side of the MACD indicator. This highlights that the trend may continue upward.
EMA
The price is going up on the 1D chart. It is above the 50, 100 & 200 EMA (exponential moving average), which is supporting the trend upwards. The buyers are stronger than the sellers which shows buyers are ready to buy at every price. To change the direction, the price has to go down and stay below the 50, 100 & 200 EMA.
Bollinger Band
The MSFT price is trading at the upper band of the Bollinger Band indicator. After taking support from the 20-day Simple Moving Average (SMA) of the Bollinger Bands, it is indicating more upward move.
Conclusion
As per the price action, the MSFT coin price is bullish. As of now, the technical parameters indicate bullish pressure in the upcoming trading days. Presently, the sentiments of investors and traders are bullish.
Technical Levels:
- The Nearest Support Zone is $289.98.
- The Nearest Resistance Zone is $355.23.
Disclaimer
In this article, the views and opinions stated by the author, or any people named are for informational purposes only, and they don’t establish investment, financial, or any other advice. Trading or investing in cryptocurrency assets comes with a risk of financial loss.


