

- The price of SUI is trading around $0.8394.
- The 24-hour volume is $408,050,380 which increased by 39.45% in 24 hr.
- SUI price has increased by 6.22% in today’s market session.
Introduction
SUI is also known as Mysten Lab Coins. It is the native token of the SUI blockchain with a supply of ten billion tokens. Sui token is a blockchain crypto that has captured people’s attention since its launch in May 2023. SUIi token price soared 2000% on the first day of trading. SUI is used for staking.
Trend Analysis
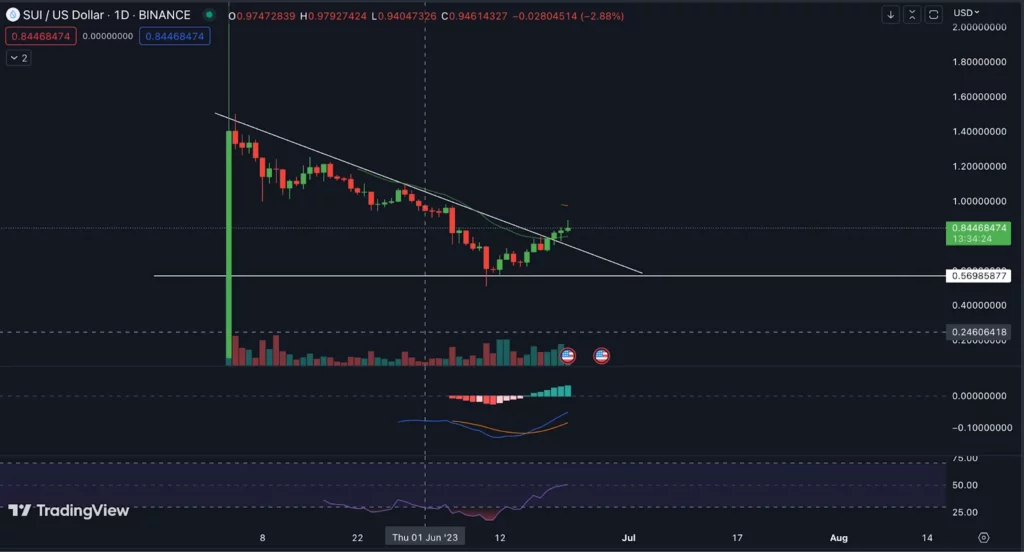
By looking at the trend and price information in the chart, we can see that SUI is in a downtrend, making lower lows. But now It has taken a reversal from the support level with good momentum and a fair amount of volume and the price has broken the triangle pattern.
SUI is Trading in Downwards Direction
Technical Analysis (1D Timeframe)
SUI Price Analysis
EMA
The SUI price is currently trading above the 20 EMA level this indicates SUI is showing bullishness in the short term and it can touch the level of an all-time high as it is its nearest resistance.
RSI
When looking at recent price action, we can observe several key technical indicators to better understand potential SNX movements. Let’s start with the Relative Strength Index (RSI), which is a momentum oscillator that measures the speed and direction of price movement. The RSI moves between 0 and 100; a value above 70 indicates overbought conditions and a value below 30 indicates oversold conditions.
Currently, the RSI for the SUI for the day is hovering around the 52 levels, indicating a relative equilibrium between buying and selling pressure. This shows no significant buyer or seller dominance at this point. There is a high likelihood the price will dominate the level, and it will go above.
MACD
The MACD, a widely used indicator, shows the relationship between two moving averages of an asset’s price. This structure is composed of the MACD line and the signal line. When the MACD line crosses above the signal line, a positive signal that indicates potential upward momentum is formed. The MACD line crossing below the signal line, on the other hand, indicates likely downward momentum and generates a negative signal.
Technical indicator MACD has produced a positive crossover, crossing the signal line from above and generating a histogram with a green bar suggesting an uptrend.
Trendline Analysis
As per the Trendline Analysis, the SUI has given the breakout above the triangle pattern, and it will go up
Conclusion
According to the analysis, the indicators support the movement on the bullish side in a short time. “MACD”,“RSI”, and “EMA” are favoring the momentum upside and we can expect a bull run in the upcoming days.
Technical Levels:
- The Nearest Support Zone is – $0.5698
- The Nearest Resistance Zone – is $1.4337
Disclaimer
The views and opinions of the author, or anyone named in this article, are for informational purposes only. They do not offer financial, investment, or other advice. Investing or trading crypto assets involves the risk of financial loss.


