
- KAVA price is currently trading at $0.944
- The 24-hour volume is $43,327,950, which decreased by 55.54% in 24 hr.
- KAVA price has been observed to decrease by 1.16%.
KAVA is a cryptocurrency that mainly focuses on DeFi i.e. decentralized finance solutions. It allows users to access various services from different blockchain networks. Kava, a platform for decentralized and secure access to loans, stablecoins, and other financial services, was developed on the Cosmos blockchain utilizing the Tendermint consensus algorithm.
Because of its distinctive architecture, the Kava platform can communicate with other blockchain ecosystems. Kava extends its scope and offers cross-chain capability by connecting to other blockchains, including Bitcoin, Ethereum, and Binance Chain, through bridges. The Kava lending platform, where users may borrow and lend digital assets, including stablecoins, is one of the essential parts of the Kava ecosystem. Users can take advantage of these chances to get money through collateralized loans or to earn interest on their holdings.
Trend Analysis
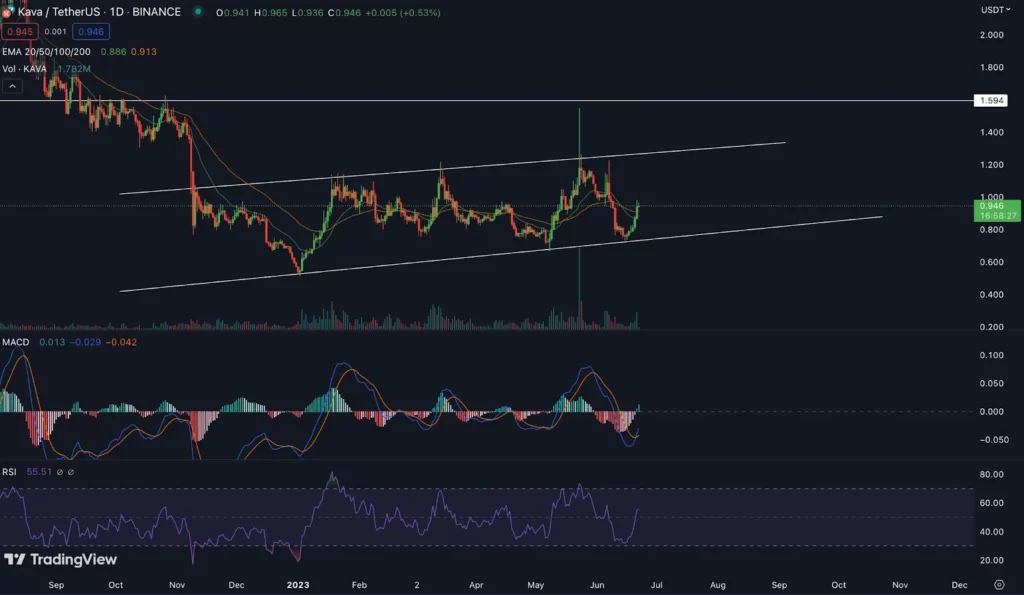
The price of KAVA was moving in a channel pattern, and prices reversed from the support with very good momentum, and volume was increasing, indicating some buyers were active. They have taken the position from the below levels. This might lead to the momentum being in favor of the bulls.
Technical Analysis of KAVA (1-Day Timeframe)
KAVA PRICE ANALYSIS
MACD
Looking at the most recent Kava MACD data, a positive trend and probable buying pressure are indicated if the MACD line is above the signal line.
Technical indicator, MACD has generated a crossover on the upside and it is building a histogram with a green bar indicating a possible up move.
EMA
The price is lying above the 20-50 EMA crossover indicating bullishness and it can lead to further rise in the upcoming days.
So this represents the overall pattern and structure of the KAVA is in an up trend and the chances of the price going up are more.
RSI
Now let’s talk about the RSI, a momentum oscillator that gauges the rate and variance of price changes. Between 0 and 100, it oscillates, with readings above 70 often suggesting overbought conditions and below 30 typically indicating oversold conditions. Currently, the RSI for the KAVA for the day is hovering around the 50 levels, indicating a relative equilibrium between buying and selling pressure. This shows that there is no significant buyer or seller dominance at this point. There is a high likelihood the price will dominate the level and it will go above.
Conclusion
According to the analysis, the indicators are supporting the movement in the bullish direction. If the price sustains the above level with good volume we can expect further up move. Currently the overall trend of the KAVA is in an uptrend momentum All the indicators MACD, RSI, and EMA are showing bullish moves in upcoming days.
Technical Levels
Resistance levels: $1.292 and $1.292
Support levels: $0.729
Disclaimer:
The views and opinions of the author, or anyone named in this article, are for informational purposes only. They do not offer financial, investment, or other advice. Investing or trading crypto assets involves the risk of financial loss.


