

- The price of ENJ is trading near $0.2477, The 24-hour trading volume was at $247.7 Million.
- The ENJ price is observing a rise of +0.47% in the last 24 hours.
- The ENJ year-to-date return is +2.06%.
Introduction
The ENJ coin was launched in June 2018 on the Ethereum mainnet. The ENJ coin is a product of Enjin, it offers a social gaming platform through which users can create clans, and websites, chat, and host virtual item stores.
The ENJ or Enjin coin provides an ecosystem of interconnected blockchain-based products of gaming. Enjin allows game developers to tokenize in-game items on the blockchain of Ethereum.
Trend Analysis
By considering trend and price information history, we can say that ENJ is in a downtrend. The price has declined -17.27% in the past seven days and we can say that ENJ is showing poor activity.
ENJ Trading Downwards
Technical Analysis (1D Timeframe)
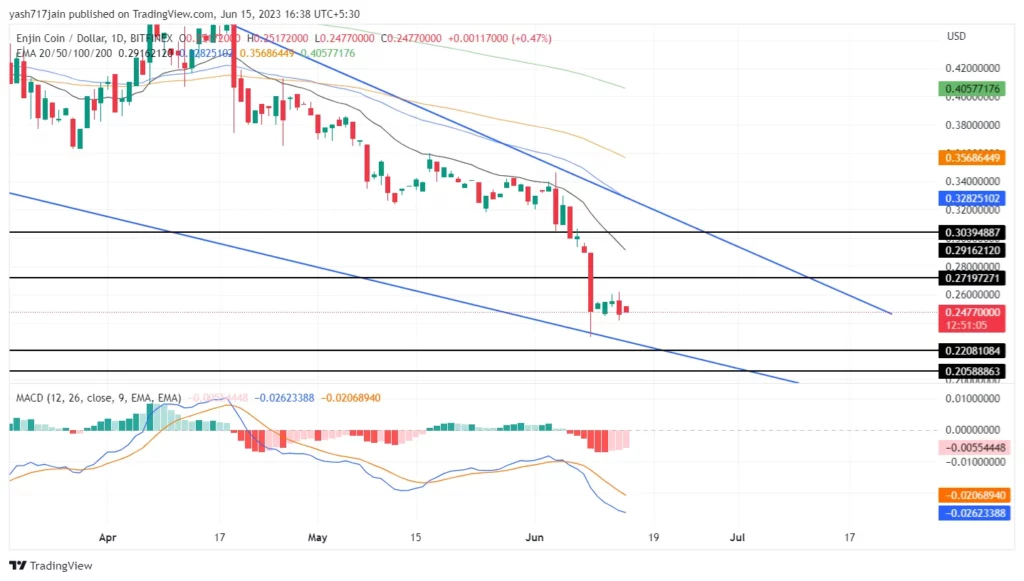
Source: ENJ/USD.1D.BITFINEX by TradingView
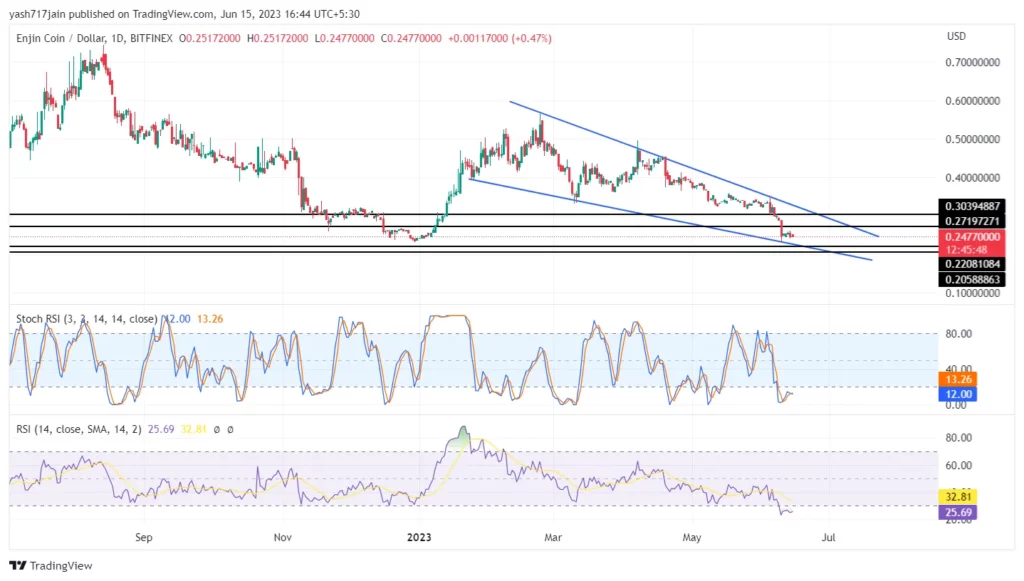
Source: ENJ/USD.1D.BITFINEX by TradingView
ENJ Price Analysis
EMA: The ENJ price is currently below the 20 and 50 EMAs, which indicates that the price will decline in the future. If sellers continue to lower the price, it could drop further in a week. So, more selling will take place.
EMA: The price of ENJ is trading below 100 and 200 EMA currently which suggests the price could fall shortly. If the sellers continue to push the price downwards, it could fall more in its value within a week. Hence, indicating sell.
MACD: In this case, the MACD line is at -0.0262 and the signal line is at -0.0206. Both are on the negative side and give bearish signals. They are also below the zero line.
Also, the indicator is considered bullish when the signal line gets cut by the MACD line from below. Likewise, the hand is considered bearish when the signal line gets cut by the MACD line from above. In this case, The MACD line crosses from above to below the signal line, and the indicator is considered bearish. Hence, indicating sell.
RSI: The Relative Strength Index shows whether a cryptocurrency is oversold when the RSI line is below 30 and also whether a cryptocurrency is overbought when the RSI line is above 70.
The RSI line has been moving in the oversold territory for the past few days. The 14 SMA has a value of 32.81 points, and the RSI line is around 25.69. This indicates that the ENJ market is in the oversold zone.
Stoch RSI: The Stochastic RSI fluctuates between 0 to 100, with readings below 20. It is considered oversold, and those above 80 reflect overbought conditions. The current %d line is at 13.26, and the %k line is at 12. This indicates that ENJ is in an oversold zone.
Trendline Analysis:
As per the Trendline, it seems it’s respecting the Trendline. For now, it’s declining from the trendline but can go downwards more soon appears to be probable. So, the price of ENJ can continue to Fall or consolidate within the trendlines range.
Conclusion
According to the analysis, the indicators support the bears. If the price continues to move under the seller’s control, it is expected to fall more soon, or it can consolidate at the current levels. Presently, the sentiments of the investors and traders are bearish due to the price of ENJ in the 1D timeframe.
Technical Levels:
- The Nearest Support Zone – $0.2208, then $0.2058
- The Nearest Resistance Zone – is $0.2719, then $0.3039
Disclaimer
In this article, the views and opinions stated by the author, or any people named are for informational purposes only, and they don’t establish investment, financial, or any other advice. Trading or investing in cryptocurrency assets comes with a risk of financial loss.


