

- The price of BRISE is trading at $0.00000024.
- The BRISE price did not have any activity in the last 24 hours.
- The BRISE year-to-date return is -51.92%.
Volume Analyzation
The amount of BRISE traded in a day is $4068824. It rose by 4.96% on the last day. The trading activity is low now because the market is unfavorable, and there are not many buyers for the coin.
Trend Analyzation
This week the trend was bearish as the price was down by 19.05%. By trend and price information history, we can say that BRISE is underperforming right now. The coin’s value plummeted by more than 51% an all-time low, wiping out the investors’ money. The market mood is bleak, and there is a lack of demand or trading activity for the coin. This may explain why the coin has performed so poorly.
In 1-D Timeframe
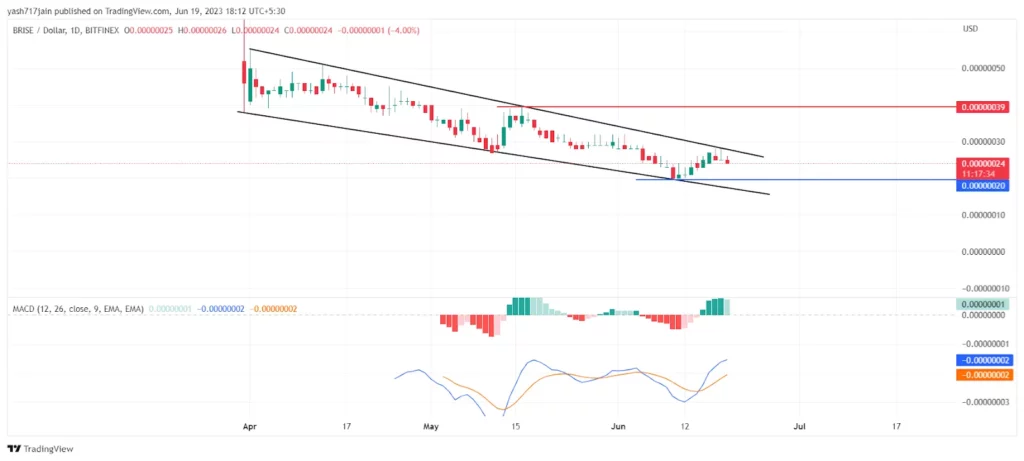
Trendline Analyzation
As per the trendline, it’s respecting the trendline taking support exactly from the drawn trendline on the chart. From the point where it inclined from the trendline, it’s been bullish. As per the price action, it has been following the channel currently. It has accepted rejection from the drawn trendline, and it can fall and reach support which is at 0.00000020, if this is breached we can see it going to zero. So, as price action speaks, it may come down to taking support. As per the trendline, it can reach $0.00000020 soon, which is our major support. If this is destroyed, it will reach rock bottom soon or even reach zero.
Supertrend
With the help of just two parameters: period and multiplier, this indicator works well. At period value 20 and multiplier value 2, it shows the continuous trend if it’s bullish or bearish. As shown in the chart, it’s bearish.
MACD
As we can see in the chart, the blue line or MACD line has crossed the signal line from above while making a bearish crossover. This indicates a bearish trend signal. On the day of writing, the MACD line is already on the negative side and the signal line is approaching the negative side of the MACD indicator. This highlights that the trend may continue downward.
200 EMA
The price is going down on the 1D chart. It is below the 200 EMA(exponential moving average), which is a hard line to cross. The sellers are stronger than the buyers. To change the direction, the price has to go and stay above the 200 EMA.
Bollinger Band
The BRISE coin price is trading at the lower band of the Bollinger band indicator after failing to surpass the upper band. After facing rejection from the 20-day Simple Moving Average (SMA) of the Bollinger Bands, it is indicating more downward move.
Conclusion
As per the price action, the BRISE coin price is bearish. As of now, the technical parameters indicate bearish pressure in the upcoming trading days. Presently, the sentiments of investors and traders are bearish.
Technical Levels:
- The Nearest Support Zone is $0.00000020.
- The Nearest Resistance Zone is $0.00000039.
Disclaimer
In this article, the views and opinions stated by the author, or any people named are for informational purposes only, and they don’t establish investment, financial, or any other advice. Trading or investing in cryptocurrency assets comes with a risk of financial loss.


