

- The price of Bitcoin SV(BSV) is trading around $28.40.
- The 24-hour volume is $53,531,783, which increased by 44.41% in 24 hours.
- BSV price has been observed to increase by 2.01%.
The Bitcoin SV (BSV) was launched in 2018. It is a cryptocurrency that originated from a hard fork of the Bitcoin Cash (BCH) blockchain. Its objective is to regain Bitcoin’s original vision by prioritizing stability and scalability and providing a high volume of transactions.
Bitcoin SV has set itself different from others by implementing a larger block size, improved stability, and providing more transactions in each block.
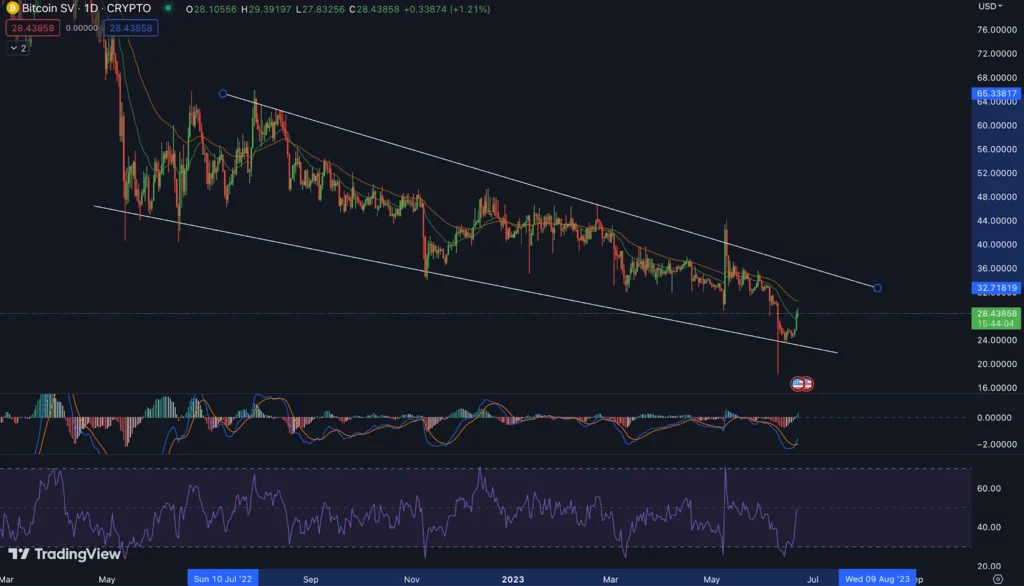
Trend Analysis
By looking at the trend and price information in the chart, we can depict that BSV is in a downtrend momentum making lower lows. It has taken a reversal from the support level and the price is trading in between the descending channel. The Return on investment of Bitcoin SV has decreased by 67.86% and we can say that it is showing poor performance for a longer time.
BSV is Trading in Downwards Direction
Technical Analysis (1D Timeframe)
Bitcoin SV (BSV) Price Analysis
EMA
The Bitcoin SV (BSV) price is currently trading above the 20 EMA, and it is below the 50 EMA, which indicates that the price will go up for a short period and again start falling after touching the level of around $35.
RSI
Currently, the RSI for the BSV for the day is hovering around the 50 levels, indicating a relative equilibrium between buying and selling pressure. This shows no significant buyer or seller dominance at this point. There is a high likelihood the price will dominate the level and it will go above.
MACD
In this case, the MACD line is at -1.61699, and the signal line is at -1.93078. Both of them are on the negative side and give negative signals. They are also lying below the zero line. Also, when the signal line cuts the MACD from below, the indicator is considered to be bullish. In the same way, when the signal line gets cut by the MACD line from the above region, the indicator is considered to be bearish. In this case, MACD is giving a crossover from below. It is indicating bullishness in a short time.
Trendline Analysis:
As per the Trendline, the price is respecting the trendline, and the price is reversing from the support level, indicating further move till the above line of the channel.
So, as of now, the price of the BITCOIN SV (BSV) moving in the channel can go up to $35.64 in a short time to touch the trendline and if sustained at the level breakout can be seen in upcoming trading days.
Conclusion
According to the analysis, the indicators support the movement on the bullish side in a short time. If the price breaks the above level with good volume, we can expect it to move further up. Currently, the overall trend of the Bitcoin SV (BSV) in a larger time frame is in a downtrend as it has touched its all-time low recently.
Technical Levels:
- The Nearest Support Zone is $23.03.
- The Nearest Resistance Zone is $36.20
Disclaimer
The views and opinions of the author, or anyone named in this article, are for informational purposes only. They do not offer financial, investment, or other advice. Investing or trading crypto assets involves the risk of financial loss.


