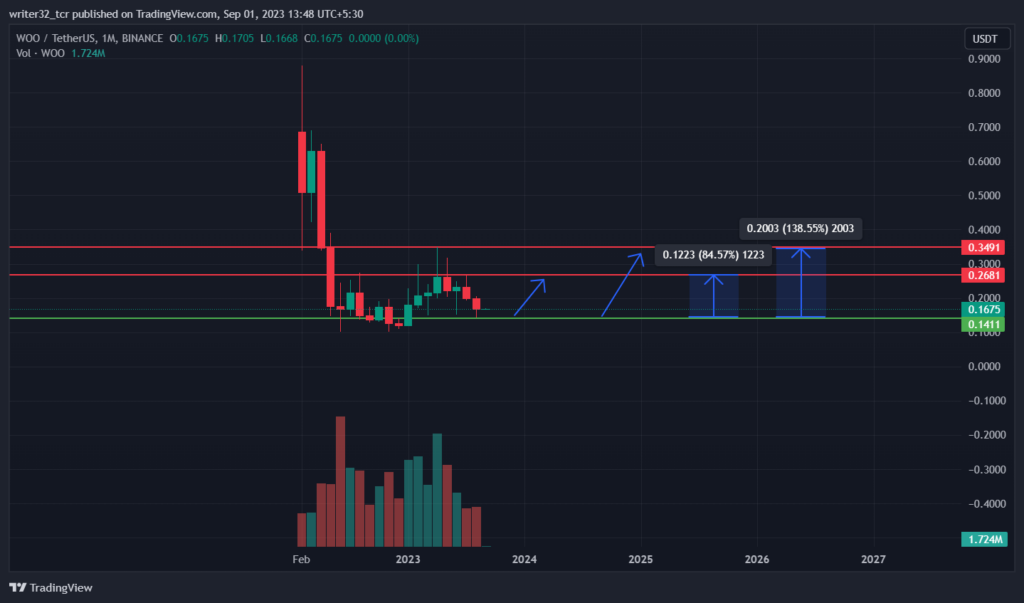
- The WOO token price could reach $0.34 by the end of 2023.
- It is currently trading at $0.167 with a dump of 2.06% in the last 24 hours.
- WOO is 93.25% down from its all-time high.
WOO token is used as collateral for borrowing or lending crypto assets. It is also used for providing liquidity using yield farming in DeFi applications. Users can shorten trading fees and also increase their rebates on referrals. They have to stake their WOO tokens on WOO X for those benefits. The WOO token is among the top 100 cryptocurrencies.
WOO is trading at a price of $0.167 with a short repulse. It is down from its all-time high. That was recorded on 16th Nov 2021 at a price of $2.48. The last big dump of the token was from the $0.63. The token has fallen about 350% from that level.
WOO is trading with a volume of $8.6M with a rise of 11.09% in the last 24 hours. It got a circulating supply of 1,741,017,173 WOO tokens.
The current market capitalization of the token is $291,452,300 with a decrease of 1.72%.
The ROI of the token has decreased by 16% in the last 1 month.
WOO TOKEN TECHNICAL ANALYSIS (1 MONTH TIMEFRAME)

The chart depicts that we got a great volume at $0.12. The token also got an upward price action of around 138%. The price got hit by the resistance at $0.349 and got on the $0.14. A good bullish price action is possible in a monthly time frame if the last monthly candle takes the support from the support level of $0.14. It has been a very strong support for a long time. The token can get to $0.26! If it breaks that resistance, it can reach up to $0.35. The coin may provide a 1.5x to 2x return after successfully testing the support.
In a bearish scenario, we can expect the price to trade at $0.10 in the worst-case scenario.
RSI AND MACD ( WEEKLY )

The Relative Strength Index (RSI) shows that the price is below the neutral level and is moving in the oversold region. The SMA 14 is at 47.65 points and the RSI line is at 42.96 points.
The Moving Average Convergence And Divergence ( MACD ) also indicates a bearish trend. The volume in the histogram shows a fall in the volume of the token. Both the Moving Averages are below 0, which shows a negative movement.
Both RSI and MACD will indicate a correction until the price takes support from $0.14. At the support levels, we can see the entries of the bulls and then we can see a positive indication in both the indicators.
Conclusion
The entries can occur between $0.14 and $0.15. The short-term scenario for the token will be bearish until we get a confirmation of the reversal from the support with a sizable volume. The long-term scenario of the token remains bullish. The price can reach $0.34 in 2023.
Technical Levels:
SUPPORT – $0.14
RESISTANCE – $0.26 AND $0.34
Disclaimer
The views and opinions stated by the author, or any people named in this article, are for informational purposes only and do not establish financial, investment, or other advice. Investing in or trading crypto assets comes with a risk of financial loss.


