- Monero (XMR) price prediction highlights a phase of consolidation.
- XMR token is down 2.14% in the last 24 hours.
- Monero (XMR) witnessed a return of 29.43% in one year.
Monero’s (XMR) price prediction reveals a volatile consolidation phase of the market, which began after a sharp fall in 2022. In November 2022, a bullish recovery started from its swing low of $116, and the price rose to $186.6, a 50% jump. The bulls took control and pushed XMR to support at $133.6. Since then, the price has traded between the support and resistance levels of $167.7.
When writing, the XMR crypto is trading at $165.3. The 24-hour volume declined by 27.98%. The overall market cap for XMR tokens is $3,025,668,820.
Will Monero Price Finally Break the Resistance?
Source: XMR/USDT 1D by TradingView
Monero’s (XMR) price prediction unveils that the price witnessed a dip from the resistance of $166.9 in April 2023. The price took support at $133 and started its recovery. The month of June 2023 ended in green with a growth of 22%. The present scenario shows that XMR is consolidating near the resistance level of $167.
The bulls showed strength by pushing the price above the 200 EMA, and currently, XMR rests above the 9 and 15 EMAs. The volume witnessed significant growth, indicating the interest of buyers. A consolidation near the resistance is bullish, as the price didn’t reverse immediately, and bulls are fighting to break it.
The Market is Consolidating Near the Resistance.

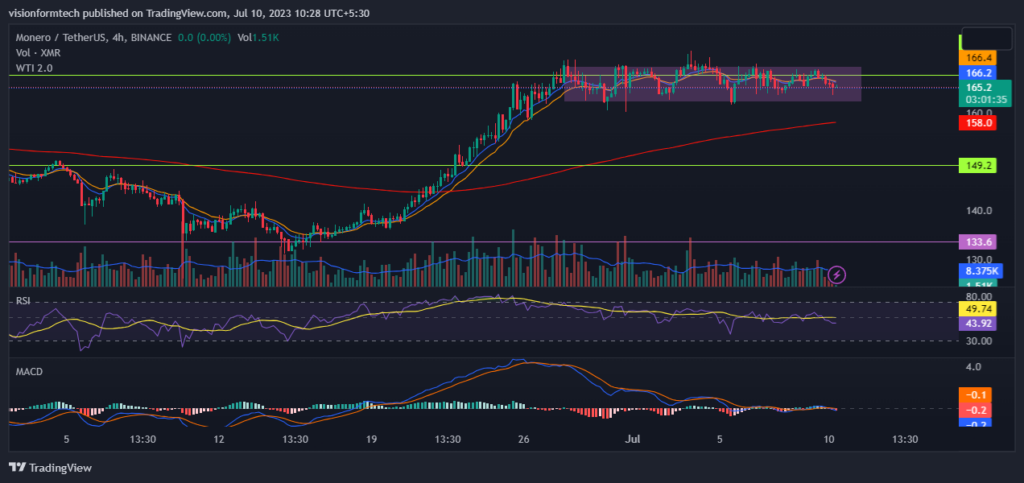
Source: XMR/USDT 4-hour chart by TradingView
On the 4-hour chart, the XMR token trades in a small range of $171 and $161. The price is trading around the 9 and 15 EMAs, which has turned flat. This range-bound consolidation began on the 27th of June, 2023. The market is getting ready for its next move. It may break in either direction, but since the market is bocce at the 200 EMA, there is a better chance of an upside. The price usually respects the levels, and a breakout is less probable. But in this case, a consolidation near the resistance may weaken the level, increasing the price.
RSI: The RSI indicator is currently at 49.67. It indicates that the market is neutral, and the prices may move sideways. The direction of the trend could be more precise.
MACD: MACD made a bearish crossover while the indicator moved close to the 0 line. The market’s direction could be more apparent as the signal and MACD lines move adjacently.
200 EMA: On the 4-hour chart, the price is trading above the 200 EMA. It is a bullish sign in which the 200 EMA acts as a dynamic support. The prices will likely increase until it breaks below the 200 EMA.
Conclusion
Monero (XMR) price prediction reveals a volatile consolidation phase of the market, which began after a sharp fall in 2022. The present scenario has a bullish bias as the consolidation is happening near the resistance. A breakout may move the price to its next resistance at $186.6. Moreover, investors are advised to exercise caution and maintain strict risk management.
Technical Levels
- The nearest support level: $169.5
- The closest resistance level: $149.2
Disclaimer
The views and opinions stated by the author, or any people named in this article, are for informational purposes only and do not establish financial, investment, or other advice. Investing in or trading crypto assets comes with a risk of financial loss.


