- The price of Celo is trading near $0.407. The 24-hour trading volume was at $3.077 Million.
- The Celo price is observing a rise of +0.49% in the last 24 hours.
- The Celo year-to-date return is -13.74%.
Celo is a carbon-negative, mobile-oriented, EVM-compatible blockchain network that aims to create well-being for all. It supports two native tokens: CELO, a governance, and staking asset, and Celo Dollars (USD), a stablecoin linked to the US dollar. Celo enables decentralized transactions, mobile DeFi, and other applications on its platform. Celo’s price today (while writing the article) is $0.407 with a market cap of $204.204 million.
Trend Analysis
By considering trend and price information history, it can be inferred that Celo is in a downtrend. The price has declined -15% within the past seven days and we can say that Celo is floundering right now.
Celo Trading Downwards
Technical Analysis (1D Timeframe)


Celo Price Analysis
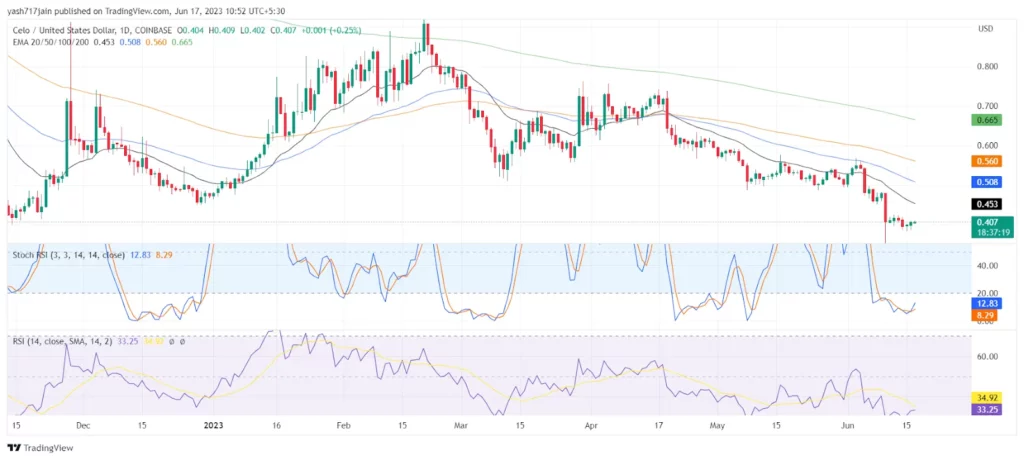
EMA 20 & 50: EMA is a type of moving average that places more weight on recent price data than a simple moving average (SMA). It reacts more quickly to price changes and can help identify trends and reversals. The Celo price is currently below the 20 and 50 EMAs, which indicates that the price will decline in the future. If sellers continue to lower the price, it could drop further in a week. So, selling is suggested.
EMA100 & 200: The price of Celo at present is trading below 100 and 200 EMA which suggests the price could fall shortly. If the sellers continue to push the price downwards, it could fall more in its value within a week. Hence, indicating sell.
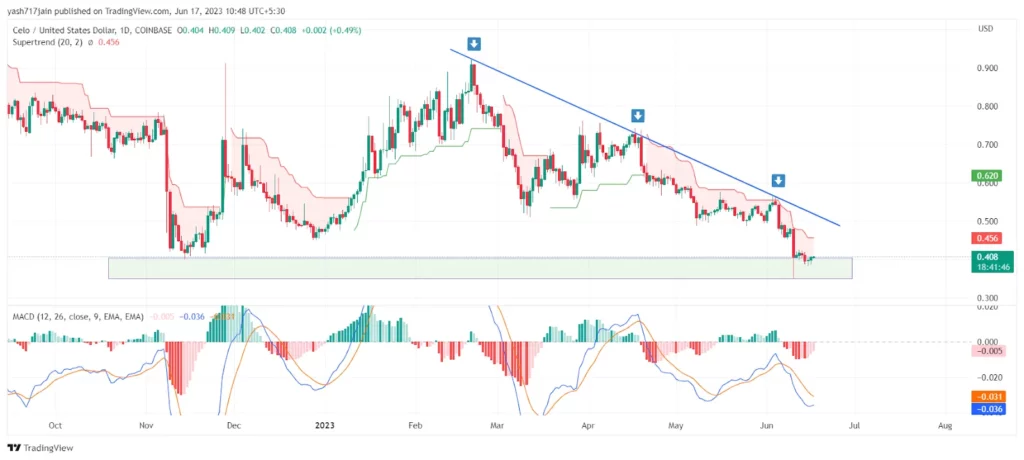
MACD: Based on this chart, we can see that the Celo coin is in a downtrend as the MACD line is below the signal line and both are negative and below the zero line. Therefore, it is indicating bearish momentum. The MACD line is at -0.341 and the signal line is at -0.270.
Also, when the signal line gets cut by the MACD line from below, the indicator is considered bullish. Likewise, when the signal line gets cut by the MACD line from above, the indicator is considered bearish.
RSI: The RSI line has been declining and approaching the oversold territory or the oversold level of 30 for the past few days. The 14 SMA has a value of 32.50 points and the RSI line is around 25.64. This indicates that the Celo market is in the oversold zone. The RSI is suggesting that the market may be losing steam.
Stoch RSI: The Stochastic RSI fluctuates between 0 to 100. With readings below 20, it is considered oversold and those above 80 reflect overbought conditions. The current %d line is at 2.80 and the %k line is at 3.14. It is indicating that Celo is in an oversold zone.
Supertrend: With the help of just two parameters; period and multiplier, this indicator works fabulously. At period value 20 and multiplier value 2, it shows signals of buy and sell. As shown in the chart, it’s bearish.
A possible technical analysis based on these indicators & trendline:
- Based on these indicators, Celo has been in a downtrend, making lower highs and lower lows.
- The MACD line is below the signal line and zero. The MACD indicator shows a bearish crossover of the MACD line and the signal line, indicating a possible continuation of the downward momentum.
- The RSI is indicating bearish pressure and possible oversold conditions.
- The price is also below all EMAs, indicating strong resistance. The EMA’s indicate a bearish trend. The EMA’s (20, 50, 100, and 200) are all sloping downwards, confirming the bearish trend. The EMA-20 and EMA-50 are acting as a dynamic resistance.
Most of the indicators point to a bearish scenario for Celo. Celo coin is trading at $0.407 as of today (while writing the article). The celo coin has been in a downtrend since reaching it’s (ATH) of $10.66. The coin has recently bounced from its all-time low of $0.351. To conclude, the celo coin is in a bearish trend and it needs a lot of buyer interest to break above resistance levels to reverse the trend. If it fails to do so, it may retest lower up to the support zones.
As per the trendline, it seems it’s respecting the trendline and it’s facing rejection exactly from the drawn trendline on the chart. From the point where it declined from the trendline, it’s been bearish but from the last couple of days, it’s taking support on the support zone. If it fails to sustain, the price may reach the given nearest supports. If the supports are breached, it can go downwards sooner. So, the price of Celo can continue to fall.
Conclusion
According to the analysis, the indicators are supporting the bears. If the price continues to move under the seller’s control, it is expected to fall shortly from the current level. Currently, the sentiments of investors and traders are bearish regarding the price of Celo in the 1D timeframe.
Technical Levels:
- The Nearest Support Zone – is $0.361, then $0.314
- The Nearest Resistance Zone – is $0.510, then $0.556
Disclaimer
In this article, the views and opinions stated by the author, or any people named are for informational purposes only, and they don’t establish investment, financial, or any other advice. Trading or investing in cryptocurrency assets comes with a risk of financial loss.


