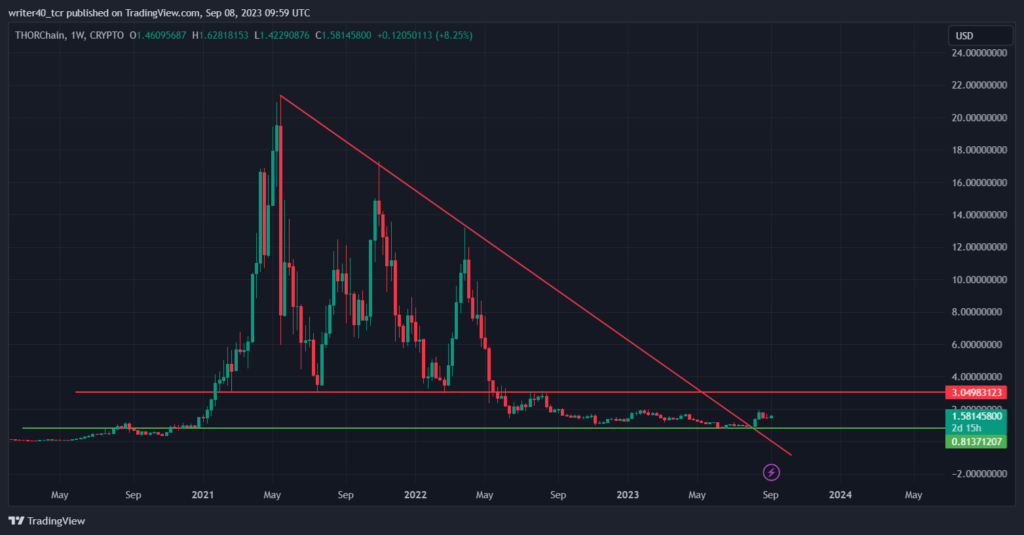
- THORCHAIN DESTROYED 90 % OF THE INVESTOR’S WEALTH FORM THE HIGHS.
- THORCHAIN SURGED MORE THAN 5% IN A WEEK AND 57% IN A MONTH.
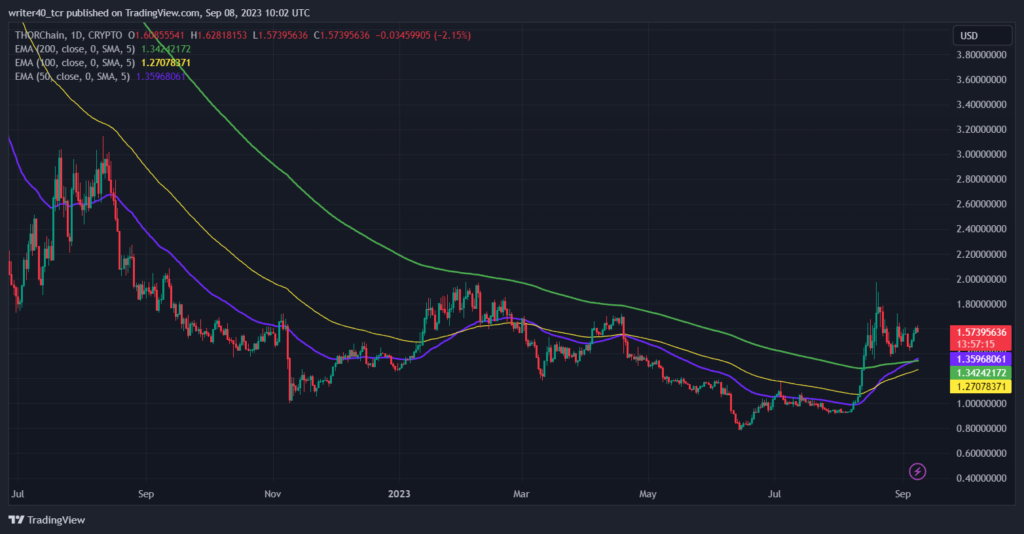
- THORCHAIN IS TRADING ABOVE THE 100 AND 200 EMA LEVELS .
MARKET CAPITAL OF THORCHAIN – $ 536 .9 M
CURRENT MARKET PRICE OF THORCHAIN – $ 1. 561
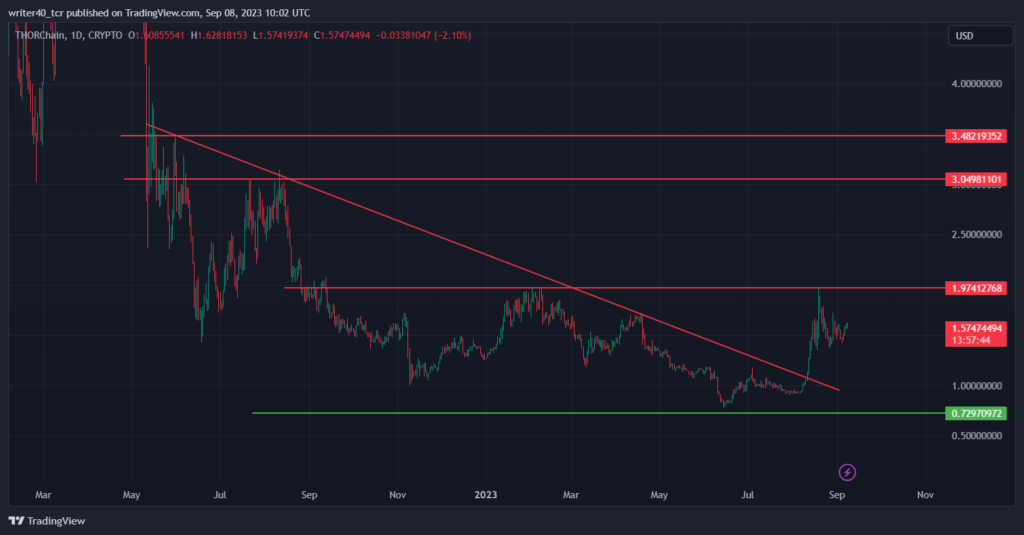
Thorchain surged more than 5% in a week and 50% in a month indicating that the price is in bullish trend in a shorter period of time. The price breaked the long term trendline that is visible in the below charts which made the buyers feel confident.
Thorchain is making a base near to the level $ 0.80 and $ 1.65 and has been consolidating in this range for more than a year. The price can face rejection at $ 3.04 levels from where the price faced the rejection previously .


The price breaked the trendline near to the level $1 and after that it reaches to the next resistance level in no time but from there it face a rejection again although the price is currently holding the upper levels
The resistance is present at $1.9 levels and then at $ 3. 04 and $ 3.48 and if we talk about the support level then the recent lows will act as support levels for the price .

The price is trading above the major EMAs i.e 50, 100 and 200 comfortably and if the price carries this momentum ahead then the price can witness the EMA crossover soon which is a bullish sign for any counter.
Also the EMA is holding the price up as the price is trying to test the below levels but EMA is restricting the price and providing the necessary support to the price.
IS PRICE READY TO MOVE UP ?
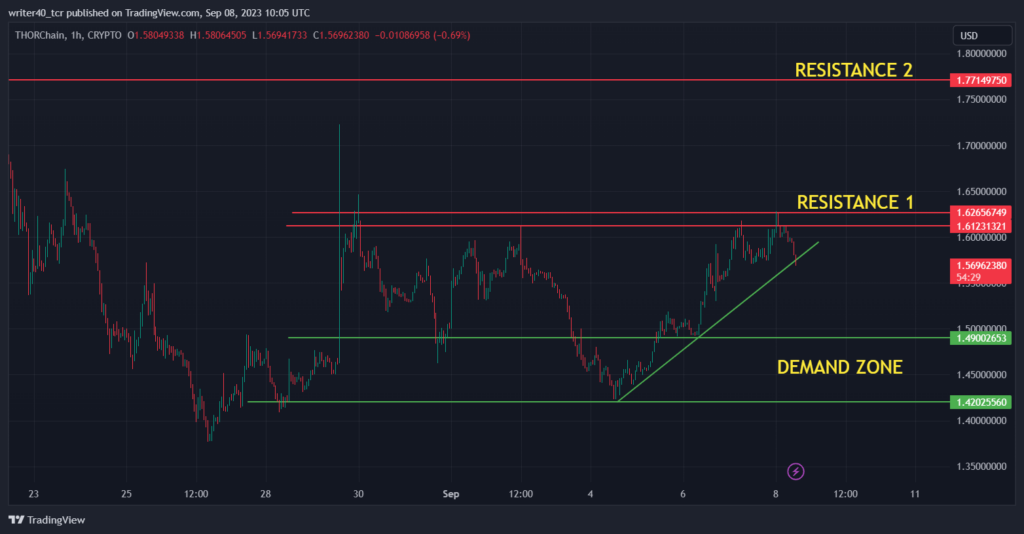
On the 1 hour chart the price is forming a higher high higher low pattern which indicates that the price is in uptrend and currently facing the resistance at the levels $ 1 .61 and $ 1.62 , the next resistance level is present at $ 1.77 levels .
If we talk about the support levels then there is a strong demand zone visible at $ 1.49 and $ 1.42 levels where the buyers are looking aggressive at price showing some sharp up move from these levels.

CONCLUSION :-
As the price breaked the major trendline and showing good momentum and the price is currently trading above the EMAs which means price is bullish, so if the price breaches the resistance levels i.e $ 1.61 – $ 1.62 then the price can further rise to $ 1.77 .
If we consider selling then if the price breaches the trendline then it can unlock the possibility of downside and can head towards to the level $ 1. 49 and $1.42.
PAST PERFORMANCE –
1 WEEK- 5.70 %
1 MONTH- 57.66%
1 YEAR – – ( 13. 46 ) %
TECHNICAL LEVELS-
RESISTANCE- $ 1. 62 AND $ 1.77
SUPPORT – $ 1.49 AND $ 1.42
DISCLAIMER-
The views and opinions stated by the author, or any people named in this article, are for informational purposes only and do not establish financial, investment, or other advice. Investing in or trading crypto assets comes with a risk of financial loss.


