

- SHEL stock price is looking to finally break its 244 days of resistance.
- SHEL stock took support from its 50 EMA on 4th August.
- The MACD and RSI have given a bullish signal; is it the time to buy?
Shell’s stock price has been going through a prolonged phase of consolidation following a rejection at the GBX 2,443 level in April 2024. This rejection created a strong resistance point, causing the price to struggle in moving higher.
Following this, the stock price experienced a breakdown below the support level at GBX 2,173, but managed to recover and swing back above it. This kind of price action often reflects a tug-of-war between bullish and bearish forces, with the support level acting as a crucial point of interest for both sides.
The fact that the stock price has remained within the range defined by GBX 2,443 (resistance) and GBX 2,173 (support) for over 400 days indicates a period of consolidation. Consolidation occurs when buying and selling pressures are relatively balanced, leading to a range-bound price movement where neither bulls nor bears dominate.
Why the SHELL Stock Does Not React to Financial Reports
The price of Shell’s stock has exhibited minimal response to both its annual and quarterly reports. This phenomenon can be attributed to several factors, primarily stemming from Shell PLC’s substantial market capitalization and its status as the second-largest investor-owned oil and gas company worldwide in terms of revenue. This influential position has cultivated a high level of investor confidence in the company’s financial stability, which has remained consistently solid over the years.
Technical Analysis of SHELL Stock Price
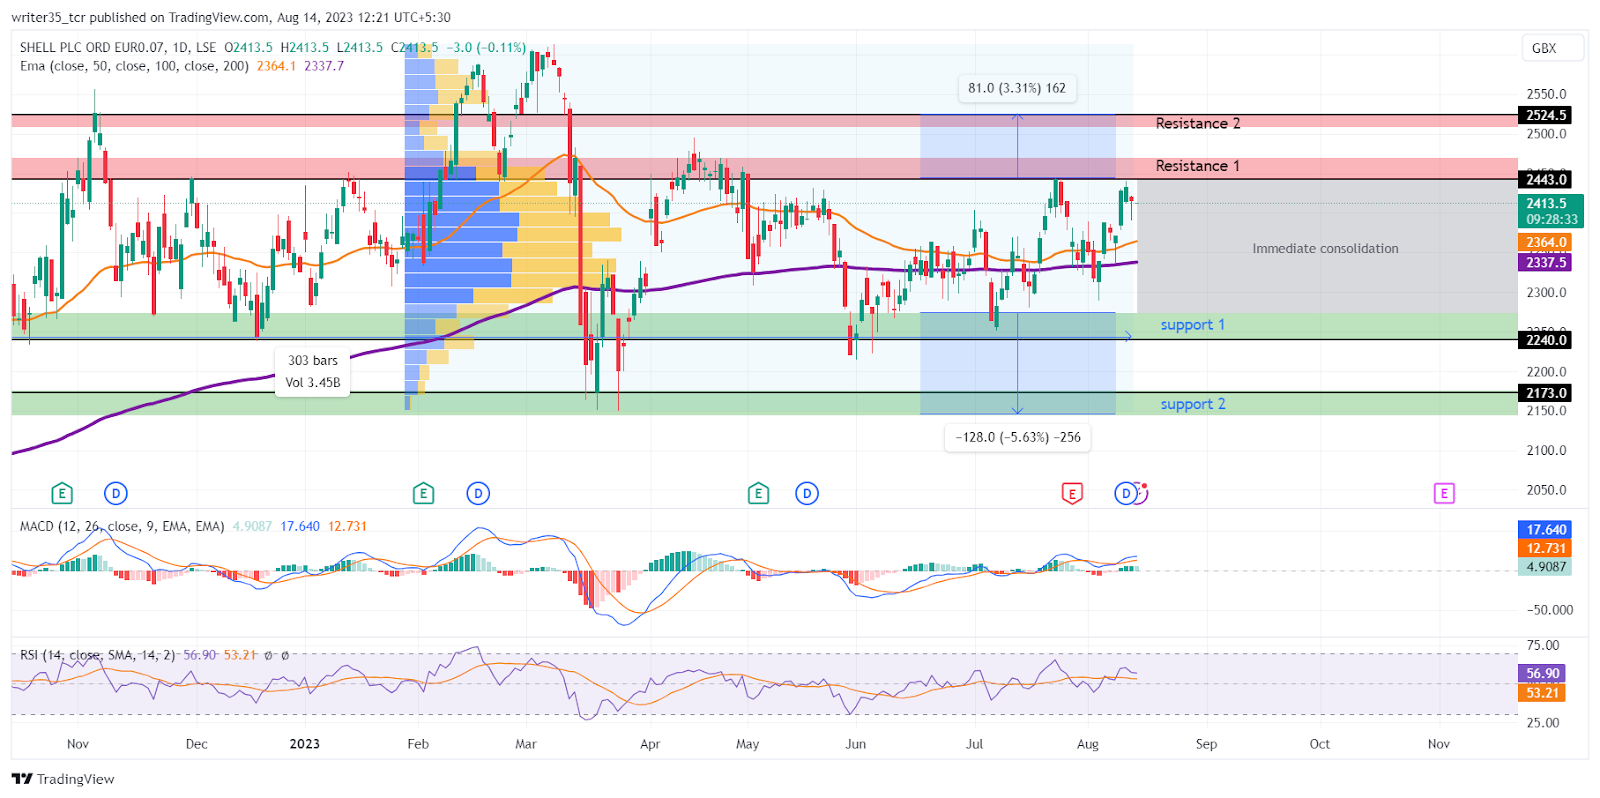
Currently, SHEL stock price has approached its resistance level and appears poised for a potential rebound, given the prevailing conditions. The stock’s movement is influenced by various support and resistance levels, with additional insights provided by technical indicators.
Support: The immediate support level for the stock is situated at GBX 2,240, forming a demand zone that has been periodically tested. Notably, this level is positioned just above a more robust second support at GBX 2,173, which is approximately 5.6% lower.
Resistance: The primary resistance lies at GBX 2,443, accompanied by a concise supply zone. A secondary resistance level can be found at GBX 2,524.
MACD: The MACD indicator is exhibiting a minor uptrend, having recently surpassed the zero line. The signal line, at present, is situated beneath the MACD line, indicating a subtle bullish signal. Specific values include the MACD at 17.64 and the signal line at 12.73.
RSI: The RSI graph is hovering near the neutral zone, with the RSI line slightly surpassing its SMA counterpart. This alignment could suggest a slight uptrend. Notably, the RSI line reads 56.9, while the SMA stands at 53.21.
EMAs: The 50-day EMA has remained above the 200-day EMA for an extended period, implying a prolonged, albeit modest, bullish momentum. The stock price is currently positioned just above the 50 EMA, resting at GBX 2,364, while the 200 EMA closely trails at around GBX 2,337.
Conclusion
Following its test of the initial resistance, the stock experienced a retracement that brought it back to the 50-day Exponential Moving Average (EMA), suggesting that bears are exerting influence around that level. Nonetheless, there is evidence of potential bullish movement as the price found some support from the 50 EMA, which could aid the bulls in advancing further. This anticipated move aligns with the bullish signals from the RSI and MACD indicators.
Technicals
Support: GBX 2,240, GBX 2,173
Resistance: GBX 2,443, GBX 2,524
RSI: 56
50 EMA: GBX 2,364
200 EMA: GBX 2,337
Disclaimer
The views and opinions stated by the author, or any people named in this article, are for informational purposes only. They do not establish financial, investment, or other advice. Investing in or trading crypto assets comes with a risk of financial loss.


